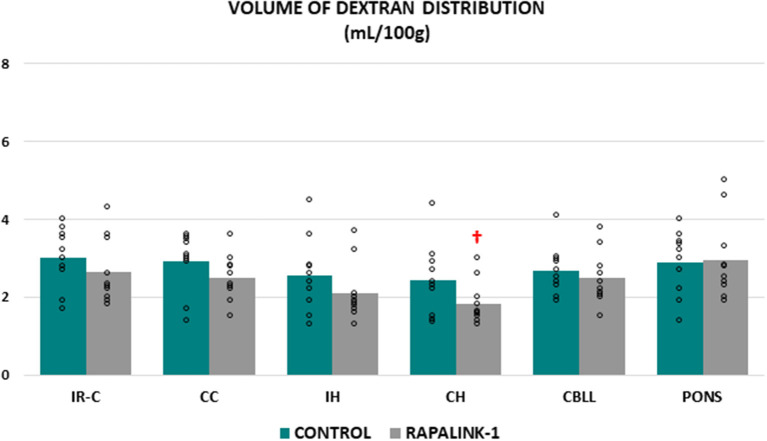
Figure 2.
Dot plots for the volume of dextran distribution in the examined brain regions of the control group (MCAO/reperfusion) and the Rapalink-1 group (MCAO/reperfusion + Rapalink-1) after 1 h of MCAO and 2 h of reperfusion. Each bar represents the mean value of each brain region. A two-way ANOVA followed by the Tukey's test for multiple comparisons was used. There were no significant changes in the volume of dextran distribution with Rapalink-1 in every brain region that was studied. IR-C, ischemic-reperfused cortex; CC, contralateral cortex; IH, ipsilateral hippocampus; CH, contralateral hippocampus; CBLL, cerebellum. n = 10 in each group. †p < 0.05 vs. pons.

