Figure 3.

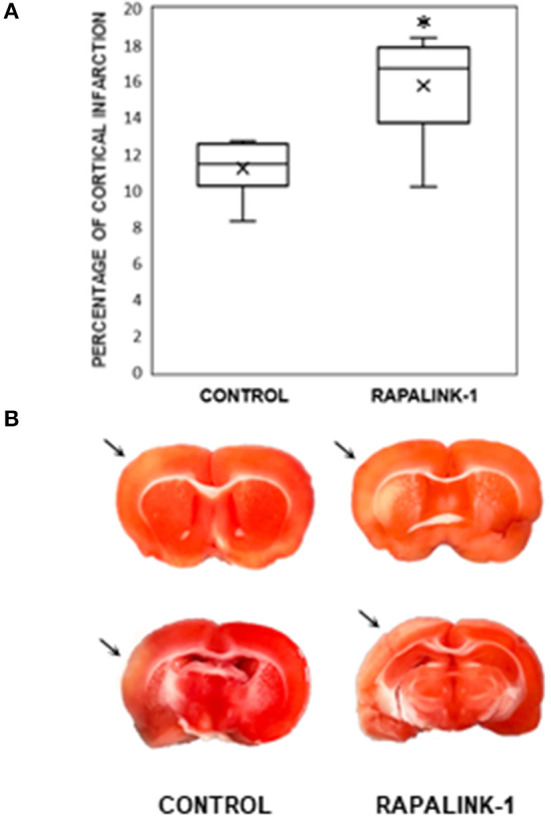
(A) A diagram with box plots showing the percentage of cortical infarcted area compared with total cortical area in the experimental groups after 1 h of MCAO and 2 h of reperfusion. Each boxplot consists of 25th percentile, median, 75th percentile, and whiskers with the minimum and maximum. Mean is shown with the symbol “×.” Rapalink-1 increased the percentage of the cortical infarct out of the total cortical area. n = 6 in each group. An unpaired Student's t-test was used for the significance. *p < 0.005 vs. the control group (MCAO/reperfusion). (B) Two representative brain sections from the similar brain regions of the control group (MCAO/reperfusion) and the Rapalink-1 group (MCAO/reperfusion + Rapalink-1). The tissue samples were photographed at 2 h after reperfusion without any fixatives. The area of the infarcted cortex appeared pink, not white, which suggests infarction is still going on. The infarcted cortices are marked with arrows. Some of the subcortical areas appeared to be infarcted.
