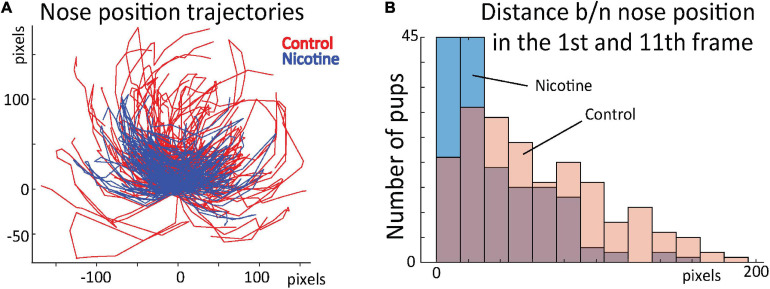
FIGURE 7.
(A) Position of rat nose during first 16 frames for control (red) and MPNE pups (blue). Each animal is represented by a line connecting 16 points. For visualization, only every 2nd animal is shown. All trajectories are aligned such that nose position in frame 1 is set to point (0, 0). (B) Distribution of distances between nose position in frame 1 and 11. The shift of distribution to the left for the MPNE group shows that nicotine exposed pups were more likely to return to the same position after first sequence of movements.

