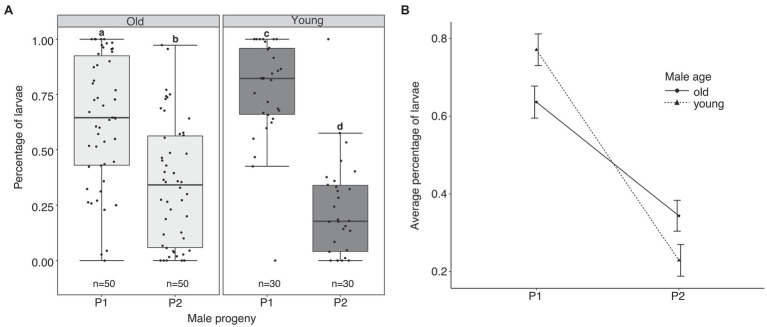
Figure 2.
Sperm use patterns in multiply mated A. aegypti females. (A) The proportion of progeny sired by the first (P1) and second (P2) mating male for each age group. The middle horizontal line in the box plots represents the median, the lower and upper margins of the box represent the 25th and 75th quartiles, and the whiskers extend to the minimum and maximum of the data (excluding outliers, shown as points outside the whiskers). Different letters above each box plot represent significant differences (p < 0.05) for a Tukey test. (B) Mean (±SE) P1 and P2 scores in females initially mated to an old or young male.

