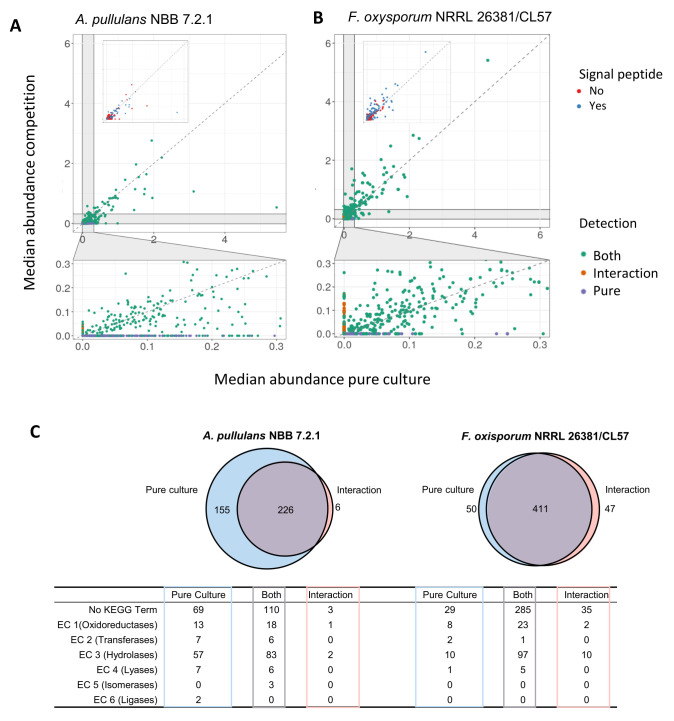
Figure 7. FIGURE 7: Secretome analysis of A. pullulans NBB 7.2.1 and F. oxysporum NRRL 26381/CL57 pure cultures and a co-culture.
Supernatant from pure and co-cultures of A. pullulans NBB 7.2.1 and F. oxysporum NRRL 26381/CL57 were filtered with a 0.2 µm membrane and concentrated with > 50 kDa ultrafiltration tubes. These extracts of secreted proteins were analysed with a proteomics pipeline. Median abundance of all proteins detected in pure culture (x-axis) and during the competition (y-axis) for A. pullulans NBB 7.2.1 (A) and F. oxysporum NRRL 26381/CL57 (B). In the upper panel insert, proteins with or without a predicted signal peptide are highlighted in blue and orange color, respectively. The lower panel shows proteins of low abundance and highlights those only detected during the competition (orange) or in pure culture (blue). (C) For A. pullulans NBB 7.2.1, only few proteins were uniquely found during the competition with F. oxysporum NRRL 26381/CL57, while for F. oxysporum NRRL 26381/CL57 almost equal numbers of unique proteins were detected in the pure culture and the competition. KEGG term annotation of the proteins in the different categories is indicated.

