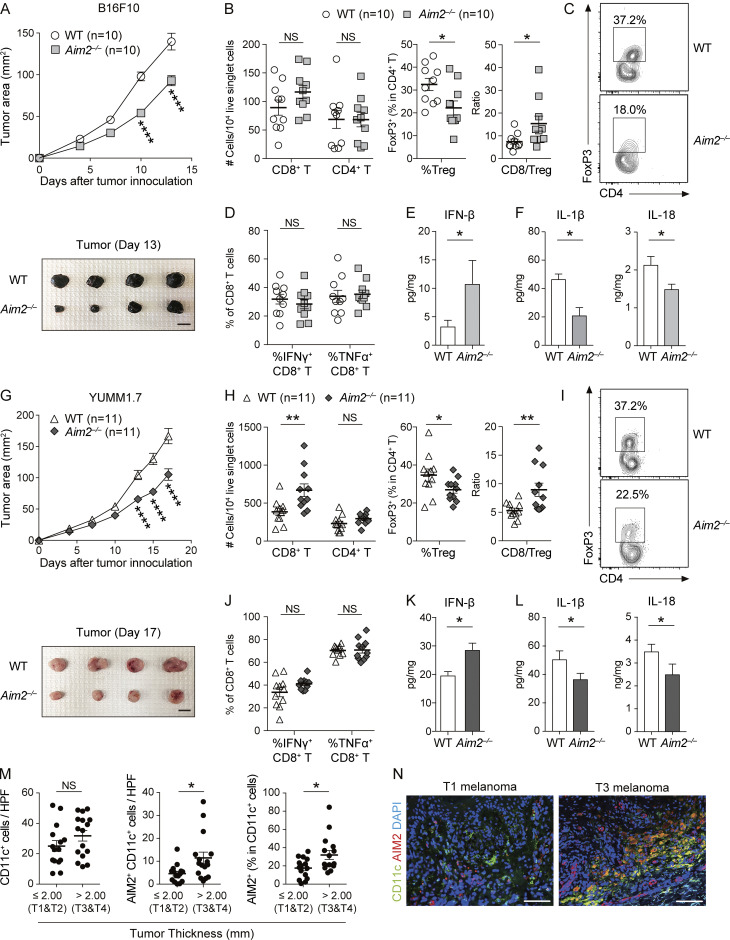
Figure 1.
AIM2 exerts an immunosuppressive effect in the melanoma microenvironment. (A–F) WT and Aim2−/− mice were inoculated s.c. with 1.0 × 10⁶ B16F10 cells on day 0. On day 13, tissues were harvested. (A) Tumor growth over time (top; n = 10). Sample photo of B16F10 tumor on day 13 (bottom). Scale bar, 10 mm. (B–D) Flow cytometry analysis of TILs (n = 10). (B) The numbers of CD8+ and CD4+ T cells among 104 live singlet cells. Percentage of FoxP3+ cells in CD4+ T cells and CD8/T reg cell ratio. (C) Representative contour plot for FoxP3 among CD4+ T cells. (D) Percentages of IFN-γ+ and TNF-α+ in CD8+ T cells. (E and F) IFN-β (n = 7; E), IL-1β, and IL-18 (n = 6; F) protein levels within the tumor. (G–L) WT and Aim2−/− mice were inoculated s.c. with 1.0 × 10⁶ YUMM1.7 cells on day 0. On day 17, tissues were harvested. (G–J) Similar analysis as in A–D was performed on YUMM1.7 tumor–bearing WT and Aim2−/− mice (n = 11). (G) Tumor growth over time (top; n = 11). Sample photo of YUMM1.7 tumor on day 17 (bottom). Scale bar, 10 mm. (K and L) IFN-β (n = 8; K), IL-β, and IL-18 (n = 7; L) protein levels within the tumor. (M) The numbers of CD11c+ and AIM2+CD11c+ cells and the percentage of AIM2+ cells in CD11c+ cells in HPF of primary lesions of human thin (n = 15) and thick (n = 16) melanomas. (N) Immunofluorescence microscopy of primary lesions of human thin and thick primary melanomas, visualized for CD11c, AIM2, and DAPI. Scale bar, 100 µm. Data are shown as mean ± SEM and are pooled from four (M), three (A, B, D, G, H, and J), or two (E, F, K, and L) experiments or are representative of at least three independent experiments (C, I, and N). *, P < 0.05; **, P < 0.01; ****, P < 0.0001; two-way ANOVA with Sidak’s multiple-comparisons test (A and G) or Mann–Whitney test (B, D–F, H, and J–M).

