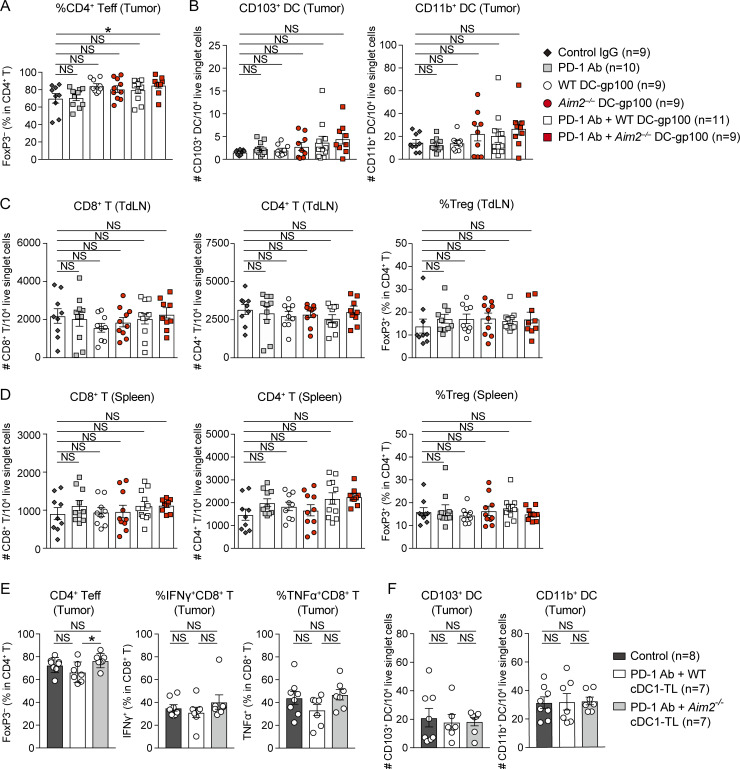
Figure S5.
Effect of AIM2-deficient DC vaccine with anti–PD-1 immunotherapy on tumor, TdLN, and spleen in the B16F10 model. (A–D) Flow cytometry analysis of the percentage of FoxP3− cells in total CD4+ T cells (A), numbers of CD103+ and CD11b+ DCs among 104 live singlet cells in the tumor (B), numbers of CD8+ and CD4+ T cells among 104 live singlet cells, and the percentages of FoxP3+ cells in CD4+ T cells in the TdLN (C) and spleen (D) of B16F10 mice treated by indicated therapies (n = 9–11). (E and F) Flow cytometry analysis of percentages of FoxP3− cells in total CD4+ T cells, IFN-γ+, and TNF-α+ in CD8+ T cells (E) and numbers of CD103+ and CD11b+ DCs among 104 live singlet cells (F) in the tumor of B16F10 mice treated by PBS (control), WT cDC1-TL + PD-1 Ab, or Aim2−/− cDC1-TL + PD-1 Ab (n = 7 or 8). Data are shown as mean ± SEM and are pooled from four (A–D) or two (E and F) independent experiments. *, P < 0.05; one-way ANOVA with Dunnett’s (A–D) or Tukey’s (E and F) multiple-comparisons test.

