Figure 1.
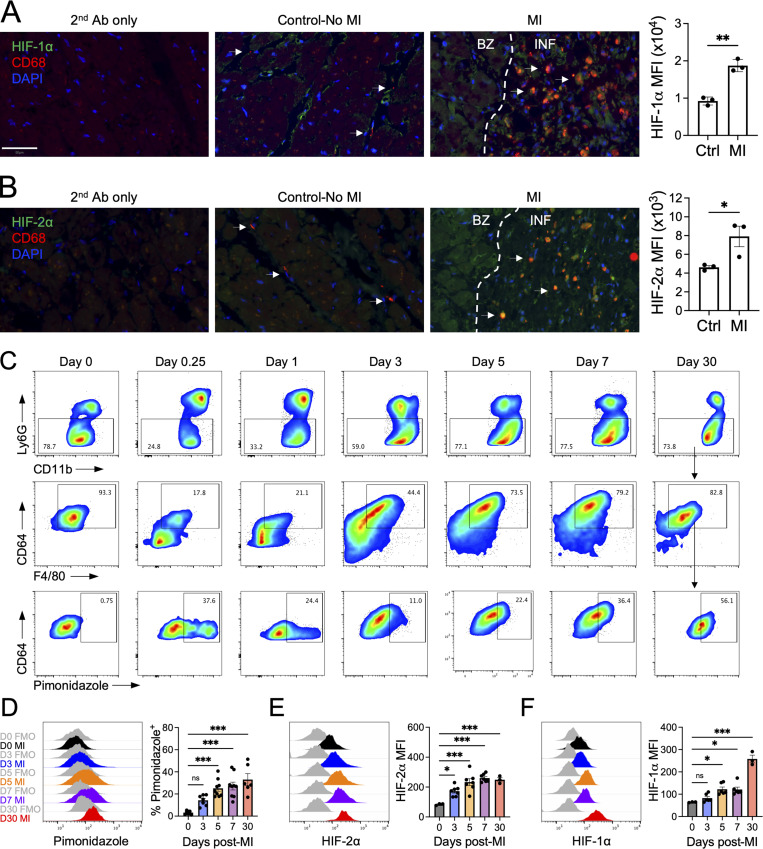
Sequential stabilization of HIF-2⍺ followed by HIF-1⍺ in cardiac macrophages after MI.(A and B) Histological analyses of HIF-1α (A) or HIF-2α (B) in CD68+ macrophages (arrows) in cardiac autopsy samples collected 5–14 d after MI with quantification of HIF mean fluorescence intensity in CD68+ macrophages. Patients with non-MI deaths were used as controls. Scale bar, 50 µm. n = 3 patients/group. *, P < 0.05; **, P < 0.01 by two-tailed, unpaired t test. (C) Gating strategy of cardiac macrophages after MI. Cells were first gated on live, single cells, and macrophages were identified as CD11b+Ly6G−F4/80+CD64+ cells. (D) Accumulation of infarct-associated cardiac macrophages within hypoxic myocardium using the hypoxia tracer pimonidazole after permanent occlusion MI in mice. n = 6–9 mice/group pooled from more than three independent experiments. ***, P < 0.001 by one-way ANOVA followed by Tukey’s test. (E and F) Expression of HIF-2⍺ (E) or HIF-1⍺ (F) in infarct-associated cardiac macrophages after MI in mice. For E and F, n = 3–7 mice/group pooled from three independent experiments. *, P < 0.05; ***, P < 0.001 by one-way ANOVA followed by Tukey’s test. All data presented as mean ± SEM. Gray histograms represent FMO staining controls. Ab, antibody; BZ, border zone; INF, infarct.

