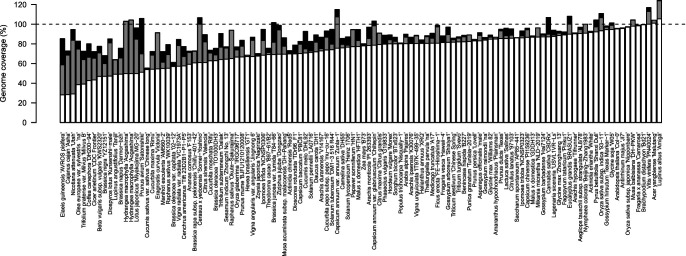
Fig. 1.
Genome coverages of assembled sequences, gap-free assembled sequences, and chromosome-level pseudomolecule sequences of the 114 plant species. The estimated genome size of each plant species is indicated by 100%. White bars indicate the sizes of gap-free chromosome-level pseudomolecules excluding sequences unassigned to any chromosomes. Gray and black bars indicate the sizes of assembled sequences without and with gaps, respectively.

