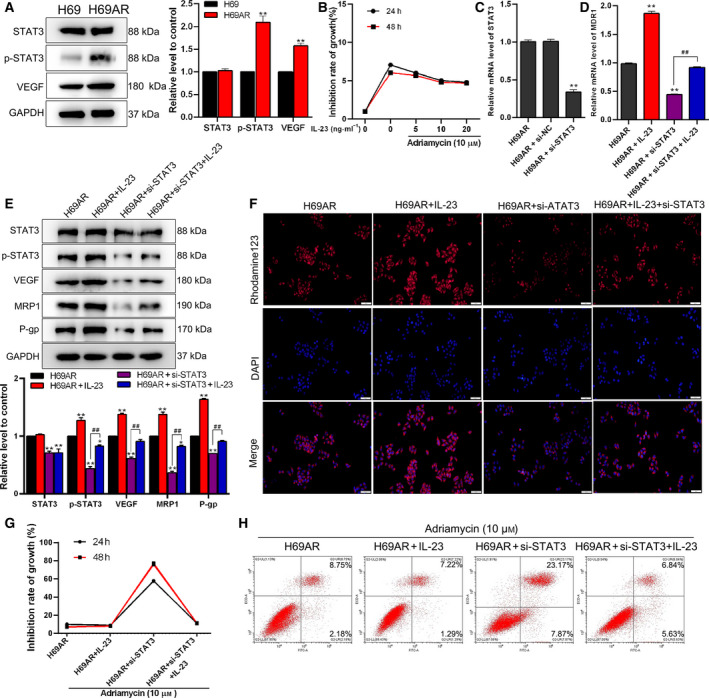
Fig. 2.

The inflammatory microenvironment plays a role in drug resistance in cancer cells by activating the STAT3/VEGF pathway. (A) Western blot analysis of the expression levels of STAT3, p‐STAT3 and VEGF in H69 and H69AR cells; GAPDH was used as a loading control. This part of the results was provided by the contractor. (B) The cell growth inhibition rate was measured by MTT assay in H69AR cells treated with Adriamycin and IL‐23 for 24 or 48 h. (C) Knockdown of STAT3, the relative mRNA expression level of STAT3 in H69AR cell, was detected by quantitative real‐time PCR. Then cells were divided into four groups (H69AR, H69AR + IL‐23, H69AR + si‐STAT3 and H69AR + IL‐23 + STAT3). (D) Relative mRNA expression levels of MDR1 were detected by quantitative real‐time PCR. (E) The expression levels of STAT3, p‐STAT3, VEGF, MRP1 and P‐gp were detected by western blot. This part of the results was provided by the contractor. (F) The activity of P‐gp was detected by rhodamine‐123 accumulation assay. Scale bar: 50 μm. (G, H) The cell inhibition rate was measured by MTT assay (G), and cell apoptosis was determined by flow cytometry (H). Student’s unpaired t‐test and one‐way ANOVA were used for statistical analysis. *P < 0.05, **P < 0.01 vs. H69AR group; ## P < 0.01 vs. H69AR + si‐STAT3 group. All results were shown as mean ± SD. Data were obtained from at least three independent experiments.
