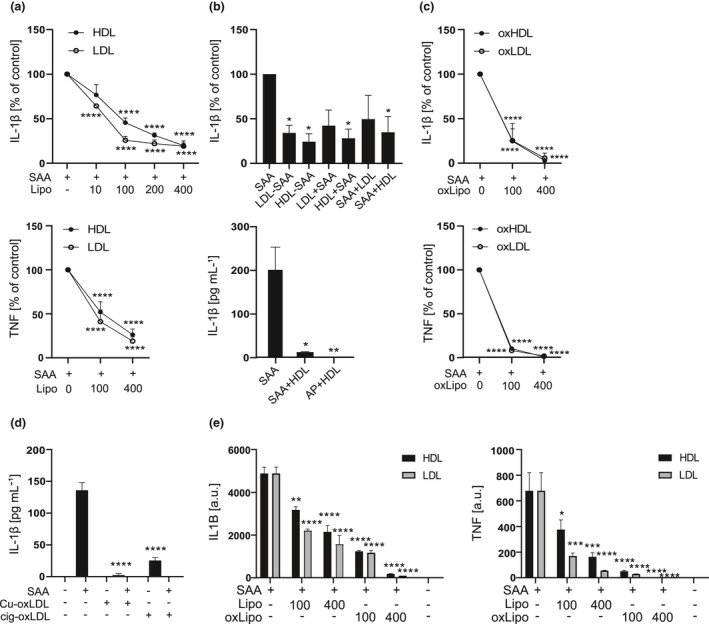
Figure 1.

Native and oxidised lipoproteins dose dependently decrease the SAA‐induced cytokine secretion. (a) Primary macrophages were subjected to native HDL3 or LDL at indicated concentrations for 1 h and then to SAA (3 μg mL−1) for 18 h. Cell culture media were analysed for IL‐1β (upper panel) TNF (lower panel) concentrations by ELISA. Data are expressed relative to SAA alone (control). (b) Upper panel: primary macrophages were subjected to preformed LDL‐SAA or HDL3‐SAA complexes for 18 h, or LDL or HDL3 (200 µg mL−1) for 1 h, followed by 18‐h activation with and SAA (3 µg mL−1) (LDL + SAA, HDL + SAA), or activated first with SAA (3 μg mL−1) for 1 h, before applying LDL or HDL3 (200 μg mL−1) for 18 h (SAA + HDL, SAA + LDL). After the incubations, cell culture media were analysed for IL‐1β concentrations by ELISA. Data are expressed relative to SAA alone (control). Lower panel: Primary macrophages were incubated with plasma‐derived acute‐phase HDL (AP‐HDL), preformed HDL3‐SAA complex or SAA (all containing 10 μg mL−1 SAA), for 18 h, and cell culture media were analysed for IL‐1β concentrations by ELISA. Data are expressed as pg mL−1 of IL‐1β. (c) Primary macrophages were subjected to oxHDL3 or oxLDL at indicated concentrations for 1 h and then to SAA (3 μg mL−1) for 18 h. Cell culture media were analysed for IL‐1β (upper panel) and TNF (lower panel) concentrations by ELISA. Data are expressed relative to SAA alone (control). (d) Primary macrophages were subjected to copper‐oxidised and cigarette smoke‐oxidised LDL (both 200 μg mL−1) for 1 h and then to SAA (3 μg mL−1) for 18 h. Cell culture media were analysed for IL‐1β concentrations by ELISA and are expressed as pg mL−1. (e) Primary macrophages were subjected to native or oxidised HDL3 and LDL for 1 h and then to SAA (3 μg mL−1) for 5 h. IL1B (left panel) and TNF (right panel) mRNA levels were analysed by quantitative real‐time RT‐PCR and are expressed as arbitrary units (a.u.) relative to GAPDH. Mean values from 4 (a), 3 and 2 (b), 5 (c, d) and 2 (e) independent experiments are shown. *P < 0.05, **P < 0.01, ***P < 0.001, ****P < 0.0001.
