Figure 7.

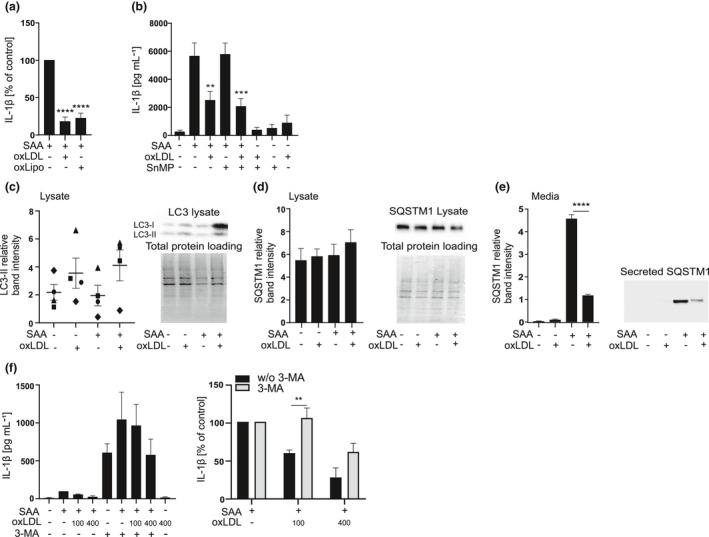
Autophagy contributes to the inhibitory effect of oxidised LDL. (a) Primary macrophages were subjected to oxLDL or microemulsion particles prepared of oxLDL (oxLipo) (both containing 450 μg mL−1 cholesterol) for 1 h and then to SAA (3 μg mL−1) for 18 h. Cell culture media were analysed for IL‐1β concentrations by ELISA. Data are expressed relative to SAA alone (control). (b) THP‐1 macrophages were pretreated with SnMP 5 mm for 3 h, and then, oxLDL 200 µg mL−1 was added for 1 h, finally cells were challenged with SAA 3 mg mL−1 for 5 h. Cell culture media were analysed for IL‐1β concentrations by ELISA. (c) THP‐1 macrophages were subjected to oxLDL (200 μg mL−1) for 1 h and then to SAA for 5 h. The intracellular levels of LC3‐II (17 kDa) and (d) SQSTM1 (62 kDa) were assessed from Western blots of the cell lysates, and (e) secretion of SQSTM1 was analysed form concentrated media by Western blotting. Data showing the independent experiments as individual symbols or as means of experiments are expressed as band intensities relative to total protein loading per lane. (f) THP‐1 macrophages were pretreated with 3‐MA 5 mm and oxLDL 100 µg mL−1 or 400 µg mL−1 for 1 h and activated with SAA 3 mg mL−1 for 5 h. On the left: secretion of IL‐1β was analysed by ELISA. On the right: the effect of 3‐MA is presented as per cent change compared to respective activated control. Mean values shown are from 3 (a) and 4 (b–f) independent experiments. **P < 0.01, ***P < 0.001, ****P < 0.0001.
