FIGURE 5.

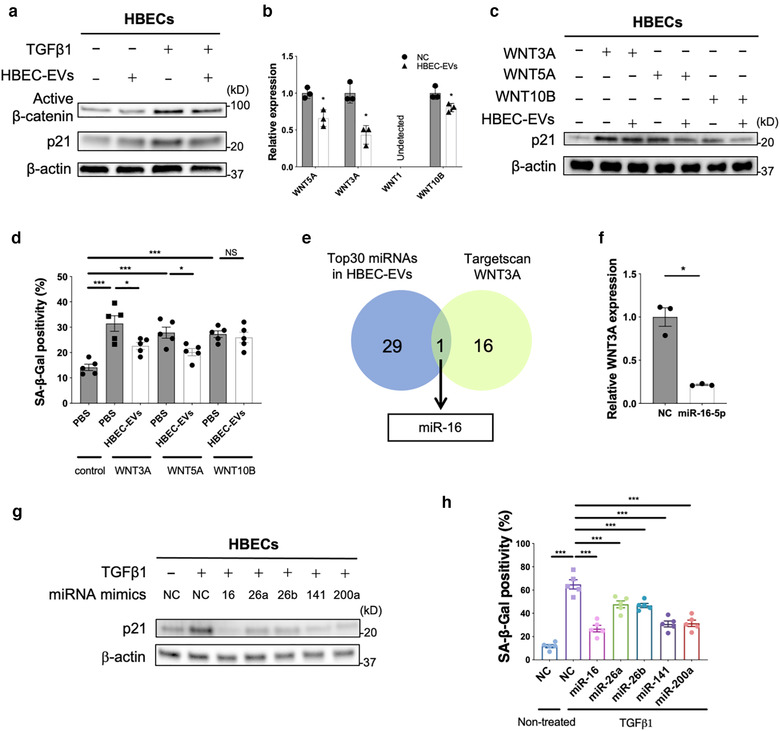
miRNA cargo in HBEC EVs attenuates TGF‐β‐induced epithelial cell senescence via suppression of WNT3A and WNT5A expression. a Representative immunoblot showing the amount of active β‐catenin and β‐actin in HBECs treated for 48 h with PBS or HBEC EVs (10 μg/ml) in the presence or absence of TGF‐β1 (2 ng/ml). b qRT‐PCR analysis of WNT1, WNT3A, WNT5A and WNT10B mRNAs in HBECs treated for 24 h with HBEC EVs (10 μg/ml, n = 3). *P < 0.05. c Representative immunoblot analysis showing the amount of p21 and β‐actin in HBECs treated for 48 h with PBS or HBEC EVs (10 μg/ml) in the presence or absence of WNT3A (200 pg/ml, lane 2,3), WNT5A (400 pg/ml, lane 4,5), or WNT10B (200 pg/ml, lane 6,7). Protein samples were collected 96 h after stimulation. d The percentage of SA‐β‐gal positive HBECs after treatment for 48 h with PBS or HBEC EVs (10 μg/ml) in the presence or absence of WNT3A (200 pg/ml), WNT5A (400 pg/ml), or WNT10B (200 pg/ml). Staining was performed 96 h after stimulation. * P < 0.05, ***P < 0.001. NS; not significant. e Venn diagram of the candidate miRNAs targeting WNT3A from TargetScan database. f RT‐PCR analysis of WNT3A mRNAs in HBECs transfected with miR‐16 mimics or negative control. *P < 0.05. g Representative immunoblot analysis showing the amount of p21 and β‐actin in HBECs treated with validated miRNA mimics or negative control in the presence or absence of TGF‐β1 (2 ng/ml). h The percentage of SA‐β‐gal positive HBECs after treatment with validated miRNA mimics or negative control in the presence or absence of TGF‐β1 (2 ng/ml). ***P < 0.001
