FIGURE 6.

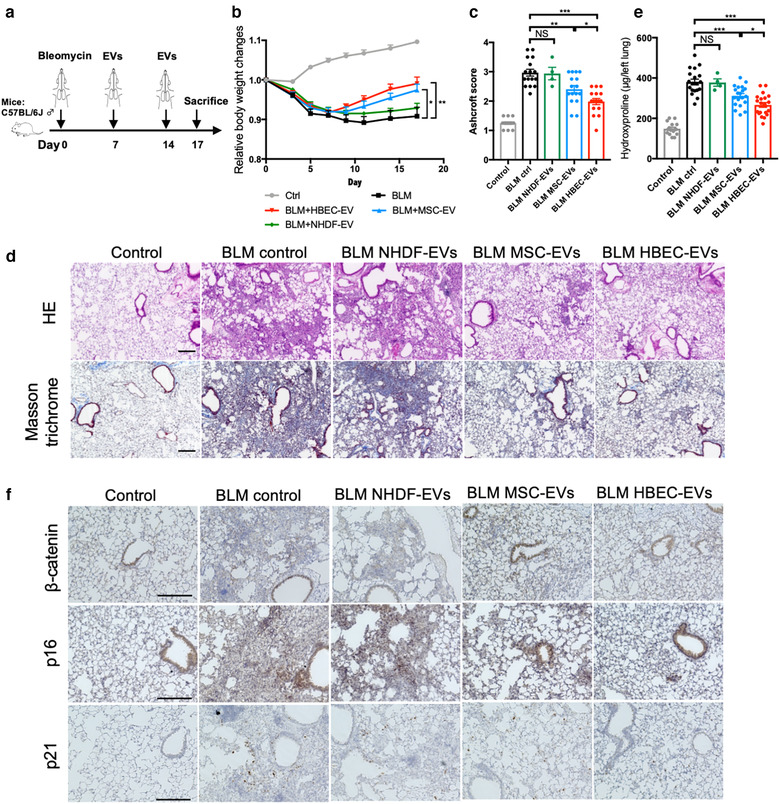
Intratracheal administration of HBEC EVs attenuates bleomycin‐induced lung fibrosis in mice. a Schematic protocol for EV treatment in the mouse of bleomycin‐induced pulmonary fibrosis. b Body weight (BW) changes after bleomycin treatment. BW at d 0 before initiating treatment was given a relative value of 1.0. Graphed values represent the mean ± SEM. *P < 0.05. Control n = 17, BLM ctrl n = 13, BLM MSC EVs n = 15, BLM HBEC EVs n = 16, NHDF EVs n = 5. c Quantification of fibrosis by Ashcroft score. Each dot represents data from one animal. *P < 0.05, **P < 0.005, ****P < 0.0005. Control n = 16, BLM ctrl n = 16, BLM MSC EVs n = 16, BLM HBEC EVs n = 16, BLM NHDF EVs n = 4. d Masson's trichrome and Haematoxylin and Eosin staining of representative lung sections from each indicated group of treated mice. Control n = 16, BLM ctrl n = 16, BLM MSC EVs n = 16, BLM HBEC EVs n = 16, BLM NHDF EVs n = 4. Scale bars, 200 μm. e Hydroxyproline content from each indicated group of treated mice. Each dot represents data from one animal. *P < 0.05, ***P < 0.001. Control n = 16, BLM ctrl n = 19, BLM MSC EVs n = 20, BLM HBEC EVs n = 20, BLM NHDF EVs n = 4. f Immunohistochemical staining of β‐catenin, p21 and p16 in representative lung sections from each indicated group of treated mice. Control n = 16, BLM ctrl n = 16, BLM MSC EVs n = 16, BLM HBEC EVs n = 16, BLM NHDF EVs n = 4. Scale bars, 200 μm
