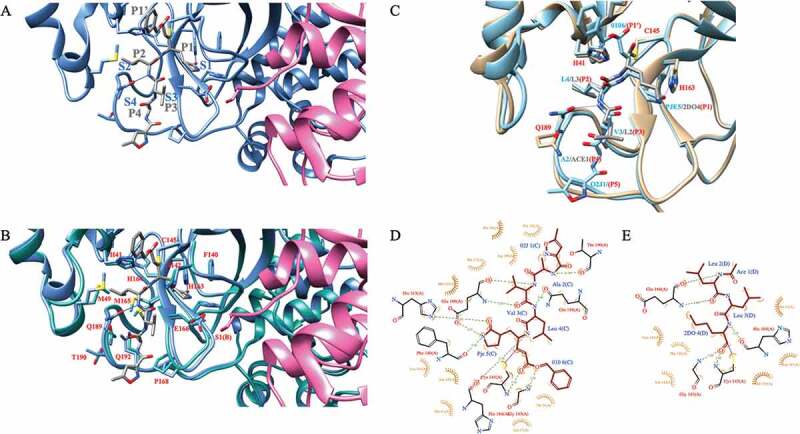
Figure 3.

A) SARS-CoV-2 Mpro in complex with a Michael acceptor inhibitor, N3 (PDB id 7BQY). The protomer A of Mpro is shown in cornflower blue whereas the protomer B is shown in pink. The backbone of N3 is shown in gray. Subsite nomenclature, from the scissile bond in the substrate, toward the N-terminus, is P1-P4 and toward C-terminus P1ʹ (gray). Complementary sites at the protease active site are S1-S4 and S1ʹ, respectively (blue). B) SARS-CoV-2 Mpro (cornflower blue) in complex with N3 (gray) overlaid with free SARS-CoV-2 main protease (light sea green; PDB id 6YB7). The protomer B is shown in pink. Key residues are highlighted and marked in red using single amino acid codes and numbering. Hydrogen bonds from Gln189 and His163 side chains to the ligand are shown in blue line. C) SARS-CoV-2 Mpro (light blue) in complex with N3 (main chain shown in light blue) overlaid with the structure of Mpro (light brown) in complex with the calpain I inhibitor (main chain shown in gray). D) 2D ligand–protein interaction diagram for SARS-CoV-2 Mpro: N3 complex. The diagram was generated with the LigPlot+ software [70]. E) 2D ligand–protein interaction diagram for SARS-CoV-2 M protease in complex with the calpain I inhibitor. 2DO is equal to (2S)-2-aminohexane-1,1-diol; ACE is acetyl group; PJE is (E,4S)-4-azanyl-5-[(3S)-2-oxidanylidenepyrrolidin-3-yl]pent-2-enoic acid; 010 is phenylmethanol; 02 J is 5-methyl-1,2-oxazole-3-carboxyclic acid. All SARS-CoV-2 Mpro figures were generated with the Chimera software package (DOI: 10.1002/jcc.20084)
