Fig. 5.
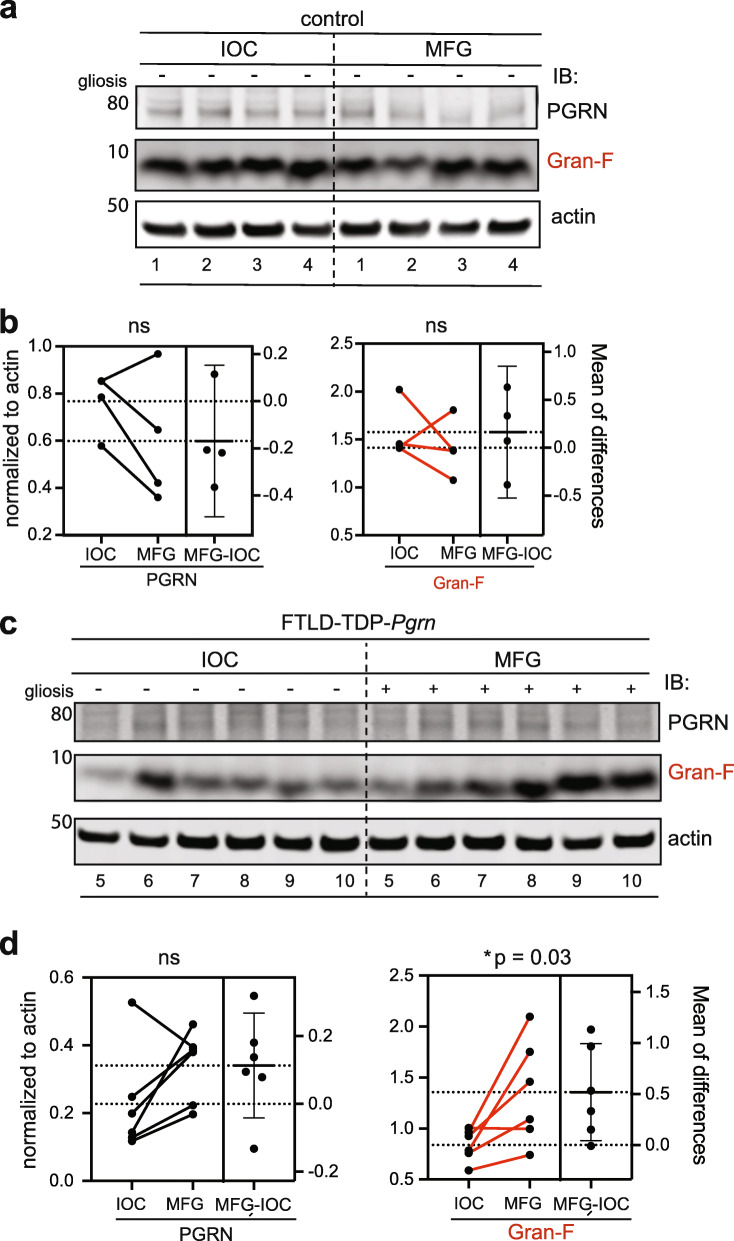
Granulins F levels in FTLD-TDP-Pgrn subjects versus controls. a, Western blot analysis of endogenous PGRN and Gran-F in IOC and MFG regions of control human brain. b, Quantification of PGRN and Gran-F levels in IOC and MFG regions in control subjects (ns, not significant). c, Western blot analysis of endogenous PGRN and Gran-F in IOC and MFG regions of FTLD-TDP-Pgrn subjects. d, Quantification of PGRN and Gran-F levels in IOC and MFG regions in FTLD-TDP-Pgrn subjects (*, p = 0.03). Error bars represent mean with standard deviation. Paired student-t test was performed between each pair. Sample numbers listed below each Western blot correspond to subject number in Table 2

