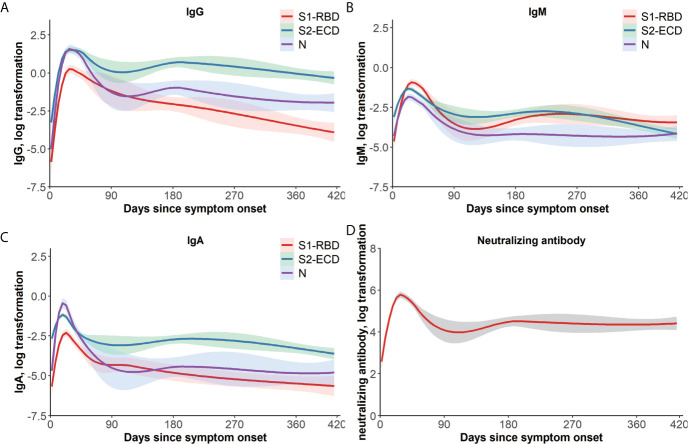
Figure 1.
One-year dynamic changes of immunoglobulins and Nab titers. LOWESS fitting curves of S1-RBD, S2-ECD, and N-specific IgG (A), IgM (B), and IgA (C). Days since symptom onset form the x-axis and log transformation of antibodies T/C value tested by a QD-labeled LFIA form the y-axis, and the differences of temporal change of antibodies could be examined by the 95% confidence intervals belt. Red, green, and purple curves represent S1-RBD, S2-ECD, and N, respectively. (D) LOWESS fitting curves of Nab titers over time. Days since symptom onset form the x-axis and log transformation of Nab titers form the y-axis. The dashed belt indicates 95% confidence intervals. ECD, extracellular domain; Ig, immunoglobulin; LFIA, lateral flow immunochromatographic assay; LOWESS, locally weighted scatterplot smoothing; N, nucleocapsid protein; Nab, neutralizing antibodies; QD, quantum dot; RBD, receptor-binding domain; S, spike; T/C, test/control.

