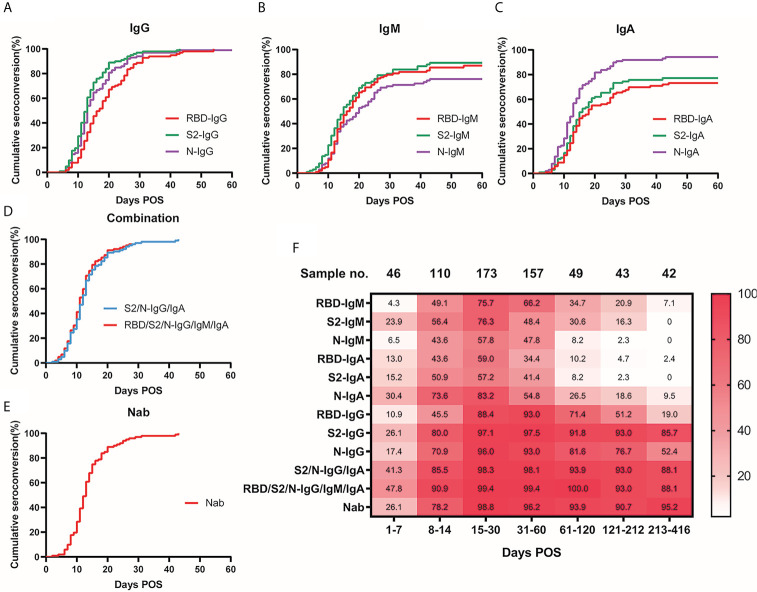
Figure 2.
Seroconversion rate of antibodies and Nab over time. Cumulative seroconversion curve of S1-RBD, S2-ECD, and N-specific IgG (A), (p = 0.0001), IgM (B), (p = 0.0213), IgA (C), (p < 0.0001). Days POS formed the x-axis and cumulative seroconversion rate formed the y-axis. The median seroconversion time (days) for antibodies targeting S1-RBD, S2-ECD, and N, respectively: IgG: 17, 13, 13; IgM: 16, 15, 20; and IgA: 18, 16, 13. Final seroconversion rate (%) for antibodies targeting S1-RBD, S2-ECD, and N, respectively: IgG: 96.1, 99.0, 98.0; IgM: 83.3, 85.3, 73.5; and IgA: 70.6, 73.5, 93.1. (D) Cumulative seroconversion curve of combination of S2/N-IgG/IgA (blue) and RBD/S2/N-IgG/IgM/IgA (red), the median seroconversion time was 12 and 11 d respectively. (E) Cumulative seroconversion curve of neutralizing activity (Nab titers ≥ detection limits of 1:20). Median seroconversion time of Nab was 13 d, and the final seroconversion rate was 99.0%. (F) Heatmap for visualization of the real-time positive rate of various specific immunoglobulins and neutralizing activity over time POS. Different shades of color indicate different positive rates (the darker the color, the higher the positive rate). Numbers in the color-block are the real-time positive rates of the corresponding time and antibodies. ECD, extracellular domain; Ig, immunoglobulin; N, nucleocapsid protein; Nab, neutralizing antibodies; POS, post onset of symptoms; RBD, receptor-binding domain; S, spike.

