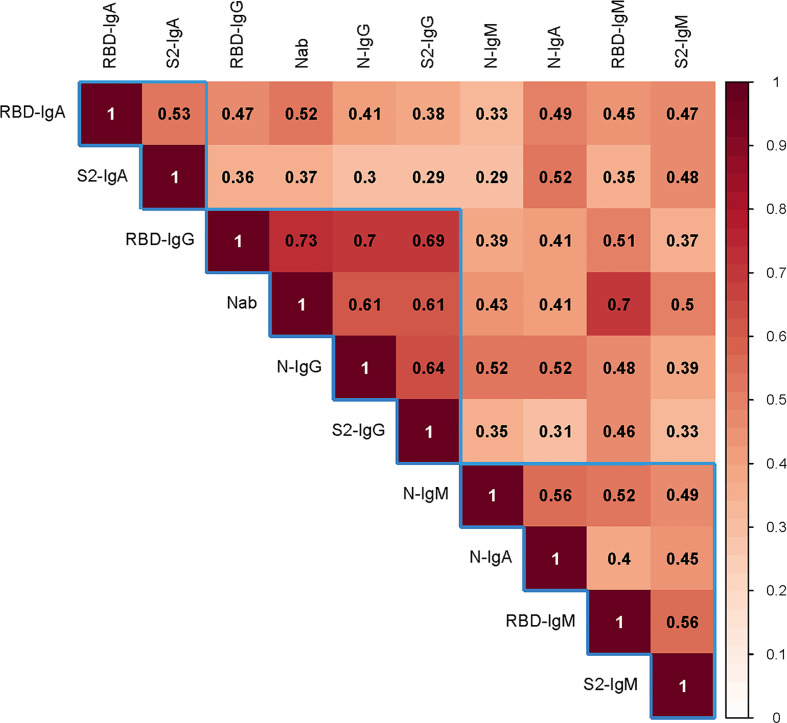
Figure 3.
The correlation between the Nab titers and various antibodies. Spearman’s correlation test was used to examine the correlation between the Nab titer with various antibodies. Darker color indicates a stronger correlation. The number in the square is the relation value. The blue frame shows the clustering relationship. Ig, immunoglobulin; N, nucleocapsid protein; Nab, neutralizing antibodies; RBD, receptor-binding domain; S, spike.

