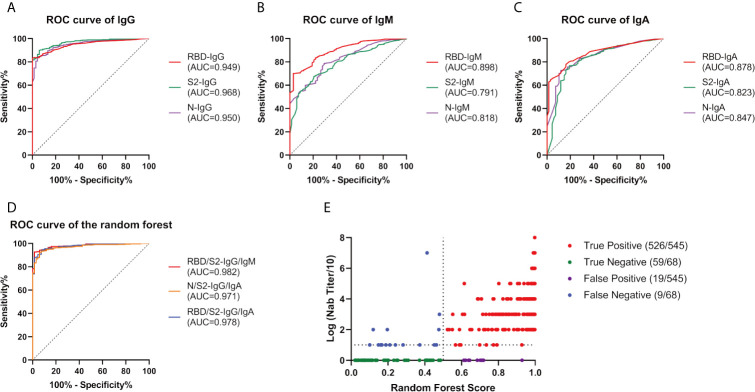
Figure 4.
Random Forest efficacy with various indicators. We constructed a random forest model to predict the Nab titers (divided by 1:20) from the tested immunoglobulins. ROC curve of IgG (A), IgM (B), and IgA (C) as a single indicator. (D) ROC curve of the indicator combinations. (E) Performance of RBD/S2-IgG/IgM in the random forest plot, every dot represents a sample, red, green, purple, and blue represent true positive, true negative, false positive, false negative respectively. AUC, area under curve; Ig, immunoglobulin; N, nucleocapsid protein; Nab, neutralizing antibodies; RBD, receptor-binding domain; ROC, receiver operating characteristic; S, spike.

