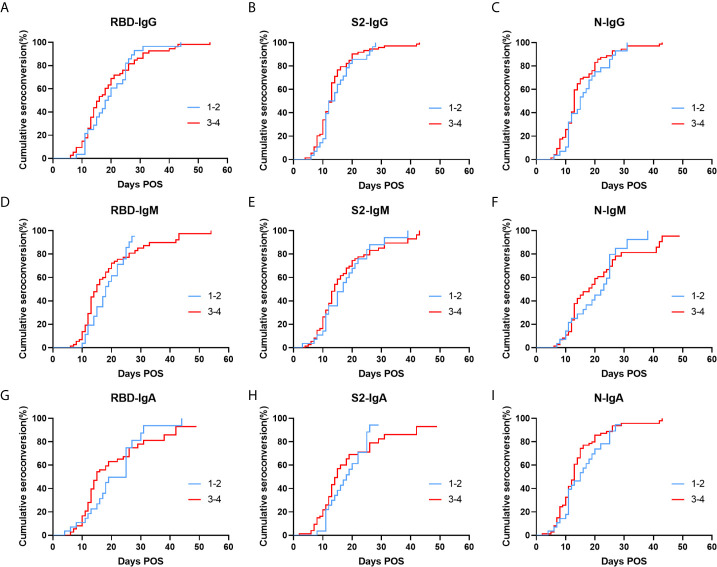
Figure 5.
Cumulative seroconversion rates of RBD, S2, and N specific IgG (A–C), IgM (D–F), and IgA (G–I) in patients with different clinical types. Patients were divided into two groups, including low severity patients (blue) with mild and moderate severity and high severity patients (red) with severe and critically ill severity. P values were determined using the Log-Rank test. All P values in this figure are greater than 0.05. Ig, immunoglobulin; N, nucleocapsid protein; RBD, receptor-binding domain; S, spike.

