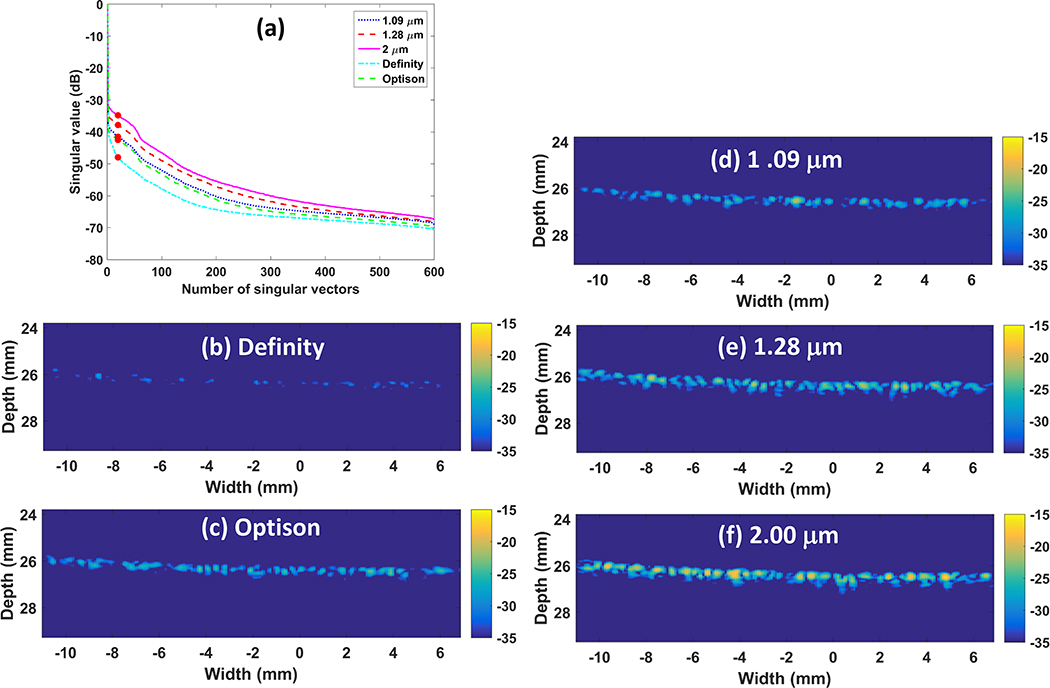
Figure 2.
In vitro results: singular value plot (a) and SVD filtered images (b-f) for commercial Definity, Optison and house-made microbubbles with mean diameter of 1.09 μm, 1.28 μm and 2.00 μm, respectively. SVD filter order used was marked as solid circles on the singular value plot (a). SVD filtered images (b-f) were normalized to the maximum intensity of B mode images from reference data. The dynamic range was 20 dB.

