. 2021 Feb 26;11(15):8899–8915. doi: 10.1039/d1ra00870f

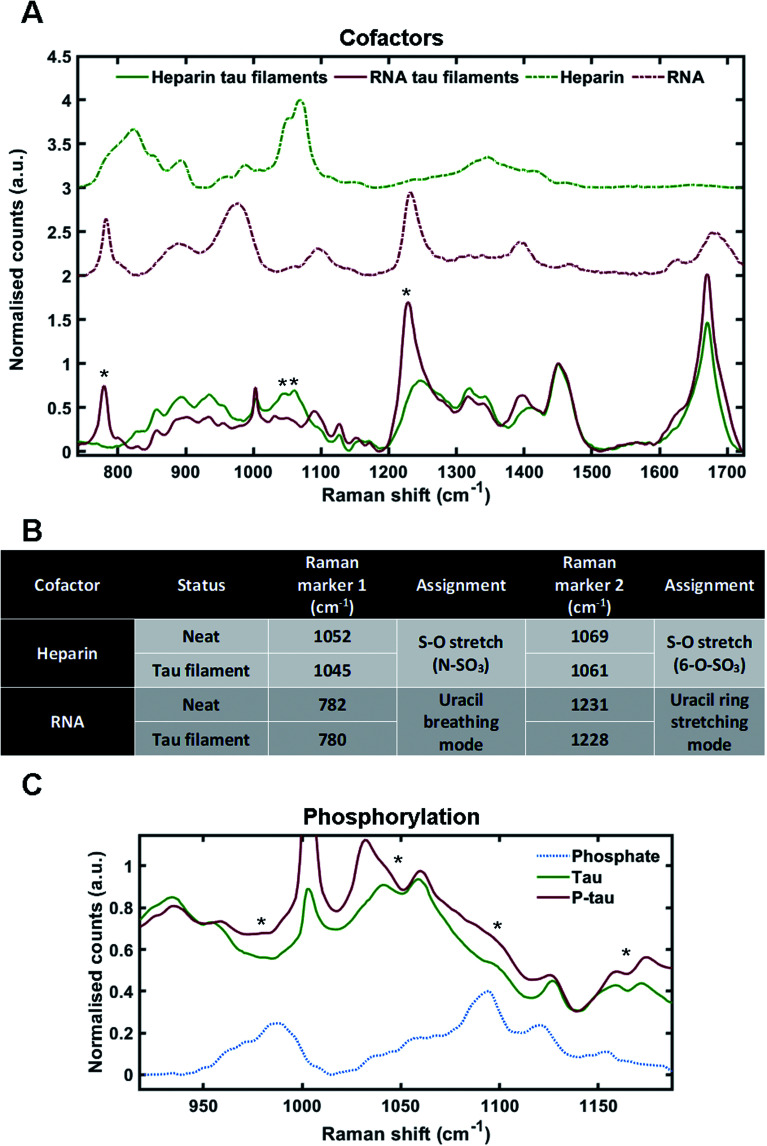
Fig. 3. Markers of heparin, RNA and phosphorylation in the Raman spectrum of tau fibrils. (A) Raman spectra of sedimented tau fibrils aggregated in the presence of heparin cofactor (green trace) or RNA cofactor (red trace), as well as pure heparin (dashed green trace) and pure RNA (dashed red trace). Asterixes represent unique markers of cofactors in tau fibril spectra. (B) Table showing the frequency of Raman markers for heparin and RNA cofactors alone (neat) and after sedimentation of tau fibrils. (C) Raman spectra of 2N4R tau fibrils aggregated in the presence of heparin (green, also shown in A), Sf9 2N4R tau aggregated in the presence of heparin (red), and neat sodium phosphate (dashed blue trace). Asterixes represent changes in tau fibril Raman spectrum that align with phosphate peaks from the sodium phosphate spectrum. Raman spectra represent the class means from multiple spectra; heparin–tau fibrils: 24, RNA tau fibrils: 9, heparin: 5, RNA: 3, Phosphorylated tau fibrils: 20, sodium phosphate: 1.

Fig. 3