. 2021 Feb 26;11(15):8899–8915. doi: 10.1039/d1ra00870f

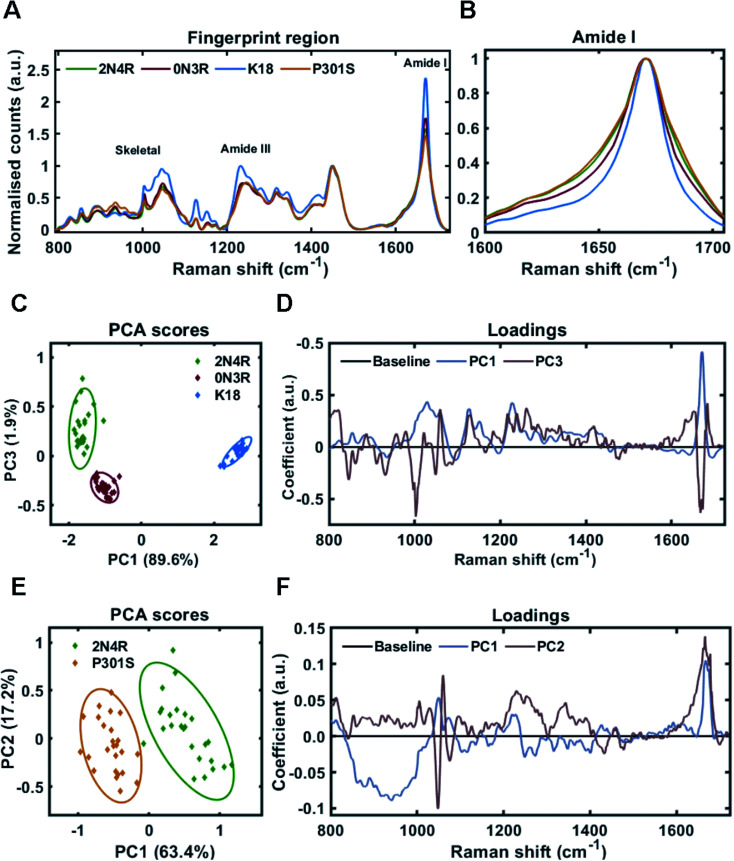
Fig. 4. Raman fingerprints of tau fibrils formed from 2N4R, 0N3R, K18 and P301S variants. (A) Raman spectra of sedimented tau fibrils aggregated in HEPES buffer under agitation in the presence of heparin cofactor. Fibrils were generated from the following tau variants; 2N4R tau (green trace), 0N3R tau (red trace), K18 tau (blue trace) and P301S tau (orange trace). Amide I, amide III and skeletal regions are highlighted. (B) Normalized amide I region for the Raman spectra shown in (A). 1600–1705 cm−1 shown for clarity. (C) 2-Dimensional principal component analysis (PCA) scores plot of Raman spectra shown in (A) including 2N4R tau (green diamonds), 0N3R tau (red diamonds) and K18 tau (blue diamonds). Each solid diamond represents the PC score of a single spectrum. (D) PC loadings spectra representing the spectral variation responsible for the score across the given PC axis shown in (C). (E) 2-Dimensional principal component analysis (PCA) scores plot of Raman spectra shown in (A) including 2N4R tau (green diamonds) and P301S tau (orange diamonds). Each solid diamond represents the PC score of a single spectrum. (F) PC loadings spectra representing the spectral variation responsible for the score across the given PC axis shown in (E). Raman spectra represent the class means from 25 spectra per class.

Fig. 4