. Author manuscript; available in PMC: 2021 Aug 3.
Published in final edited form as: Ann Appl Stat. 2019 Oct 17;13(3):1708–1732. doi: 10.1214/19-aoas1254

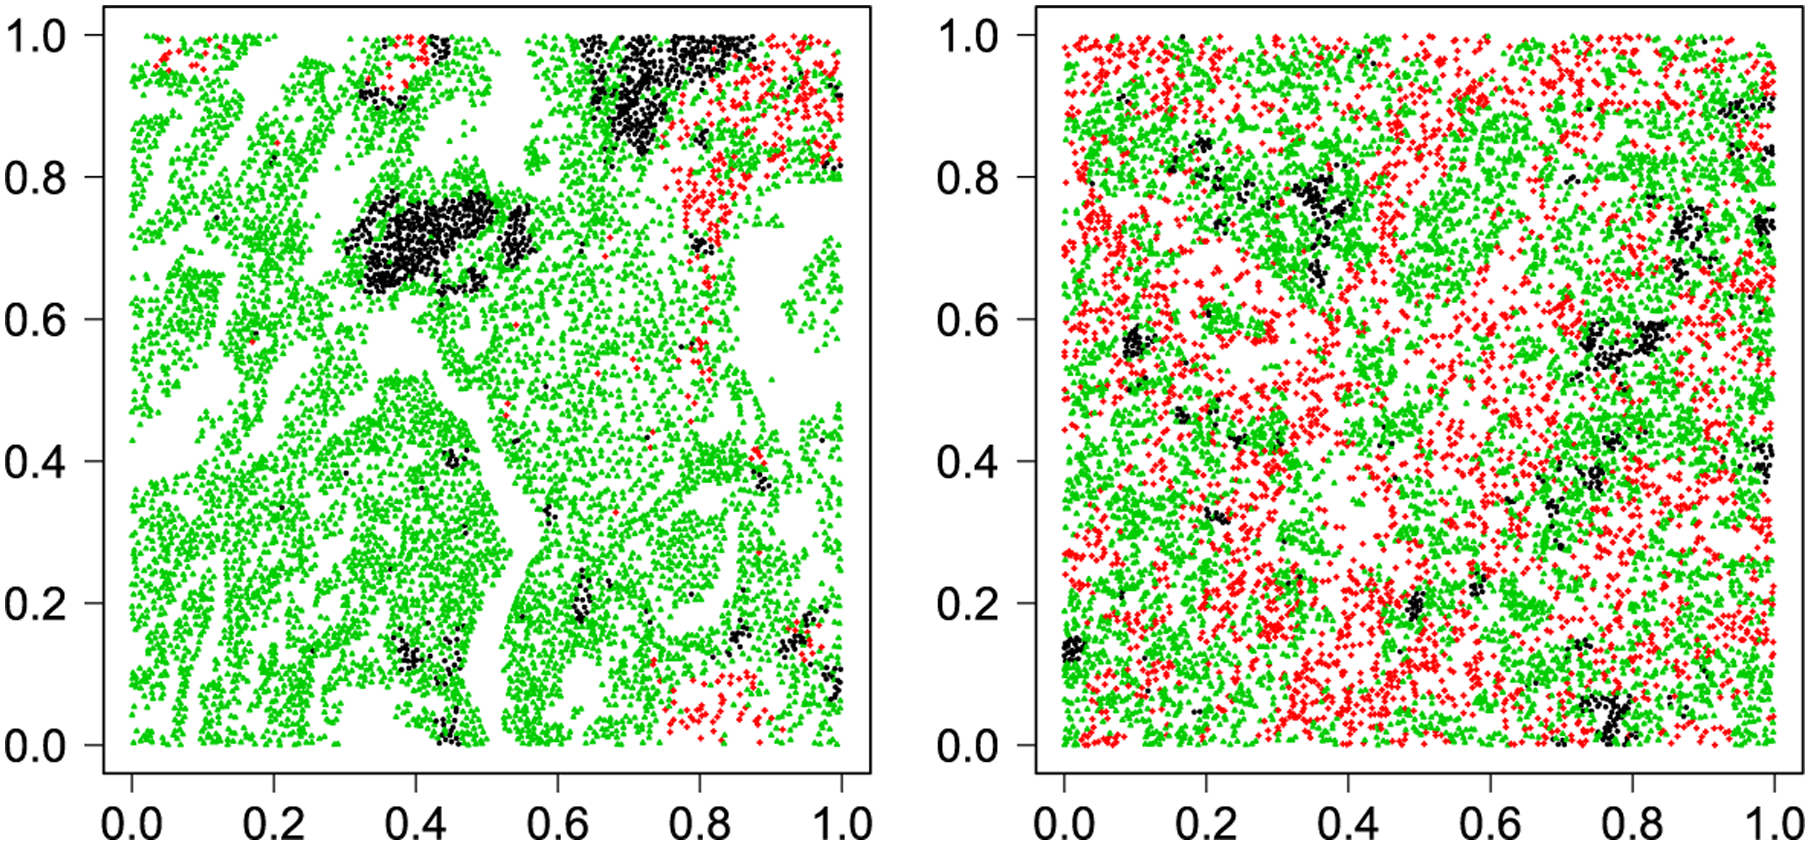
Fig. 3.

Fig. 3.

Lung cancer case study: Two examples of the rescaled marked point data from NLST dataset, where black, red and green points represent lymphocyte (○), stromal (+) and tumor (Δ) cells. For the data shown in the left, λ^=172.102, π^lym=0.022, π^str=0.173, π^tum=0.805 and ϕ^tum, str=0.012 For the data shown in the right, λ^=169.268, π^lym=0.011, π^str=0.603, π^tum=0.386 and ϕ^tum,str=0.162.