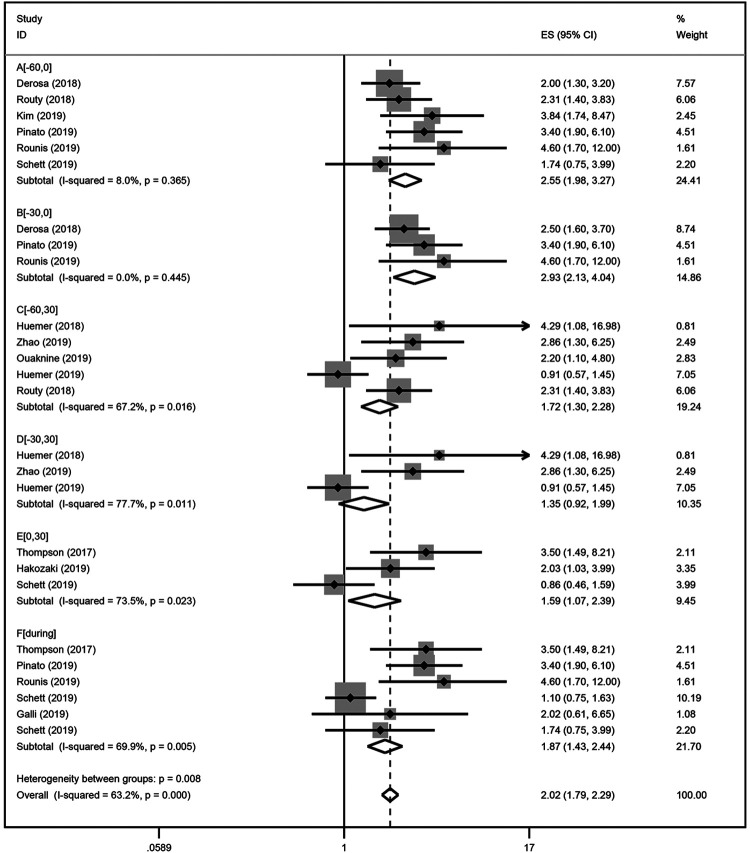
Figure 5.
A forest plot of hazard ratios for the OS of NSCLC patients exposed to antibiotics (ATB) as compared to NSCLC patients not exposed to antibiotics based on the exposure duration of antibiotics. Group A: antibiotic exposure in the following time window [−60 days; 0] relative to ICIs treatment initiation; Group B: [−30 days; 0]; Group C: [−60 days; 30 days]; Group D: [−30 days; 30 days]; Group E: [0; 30 days]; Group F: [During].

