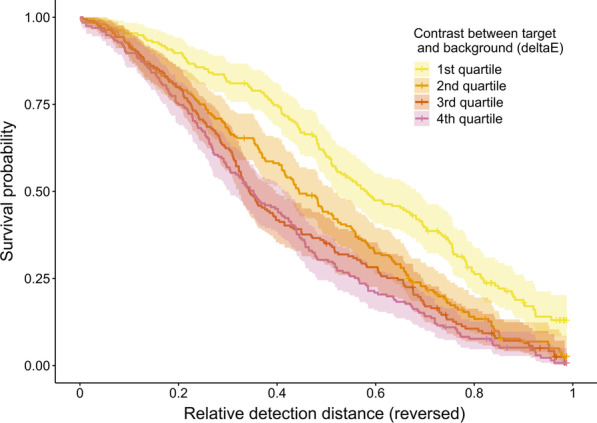
Fig. 3.

Survival probability of models based on contrast between targets and mean background colour. Background area is defined as the near zone surrounding the model hare, based on photographs taken 10 m away from the model. Contrast (∆E) values are split into quartiles for plotting purposes, with the smallest colour differences in the first quartile. Detection distance is plotted as the inverse of relative detection distance: increasing values represent movement of the participants towards the model from the theoretical maximum viewing distance, so correspond to smaller detection distances. Crosses indicate censored data (missed targets), and the shaded lines represent 95 % confidence intervals
