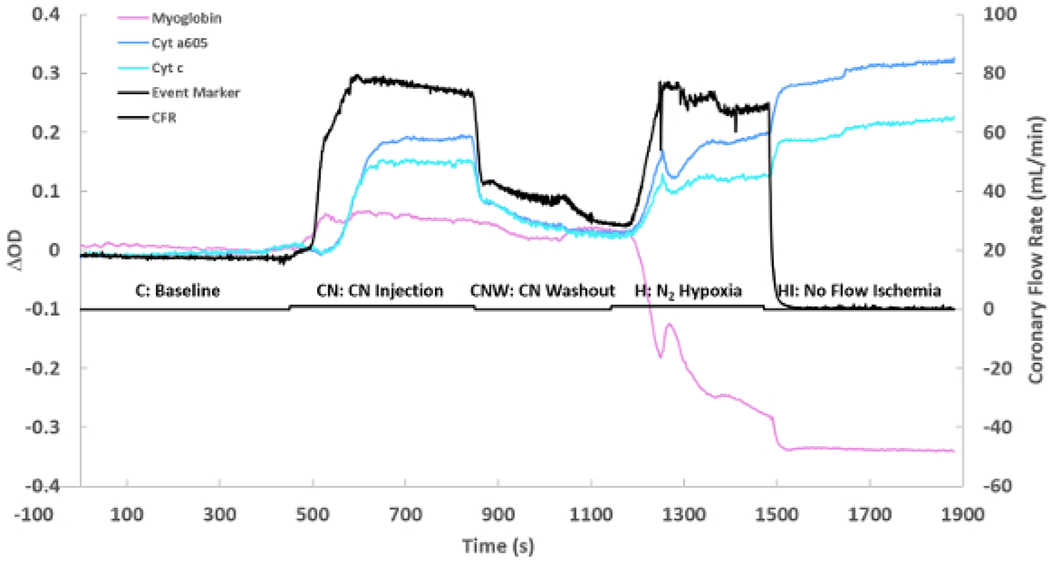
Figure 3: Flow and optical changes over time.

The optical density change (ΔOD) of each chromophore is simply the fitted individual chromophore’s spectrum at its maximum absorbance. The maximum absorbance frequencies were as previously described20,26. The presented time course is for one experiment, showing a baseline, followed by cyanide injection (0.10 mM at maximum perfusate flow), cyanide washout, nitrogen hypoxia performed by replacing oxygen with nitrogen, and then complete ischemia. Please click here to view a larger version of this figure.
