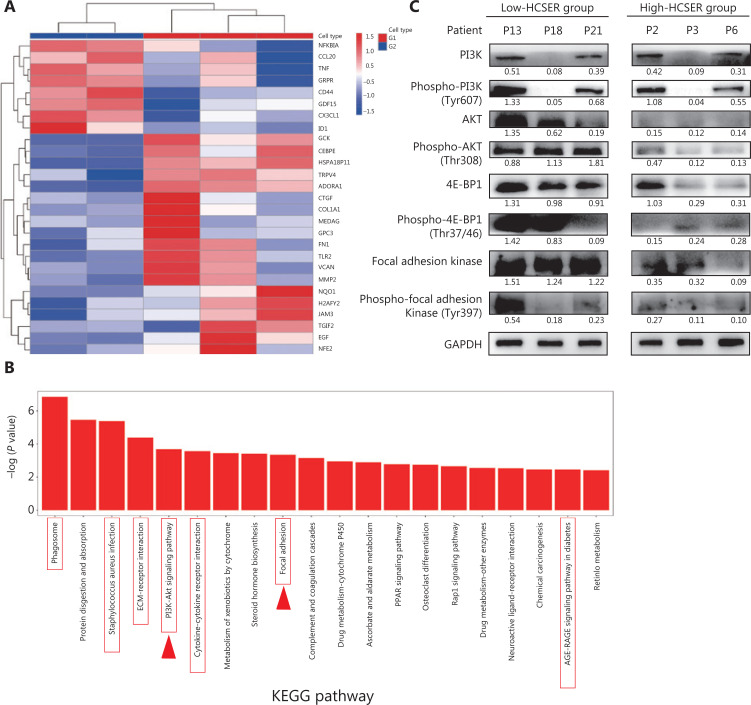
Figure 3.
Gene expression profiles of raltitrexed hyperthermia sensitization. (A) Clustered heat map of differentially expressed genes. G1 denotes patients insensitive to raltitrexed (P15, P20, and P22). G2 denotes patients sensitive to raltitrexed (P5 and P10). (B) Enrichment in KEGG pathway terms for differentially expressed genes between the G1 and G2 groups. The horizontal axis denotes the enriched KEGG pathways, and the vertical axis displays the −log10 (P-value). The red boxes represent the 27 genes participating in these pathways, and the red arrows represent pathways reported to be associated with hyperthermia. (C) Western blot analysis was conducted to assay the downregulated expression of PI3K, p-PI3K, AKT, p-AKT, 4E-BP1, p-4E-BP1, Focal Adhesion Kinase, and p-Focal Adhesion Kinase in the raltitrexed high-HCSER group. The low-HCSER group contains patients 13, 18, and 21, and the high-HCSER group contains patients 2, 3, and 6.

