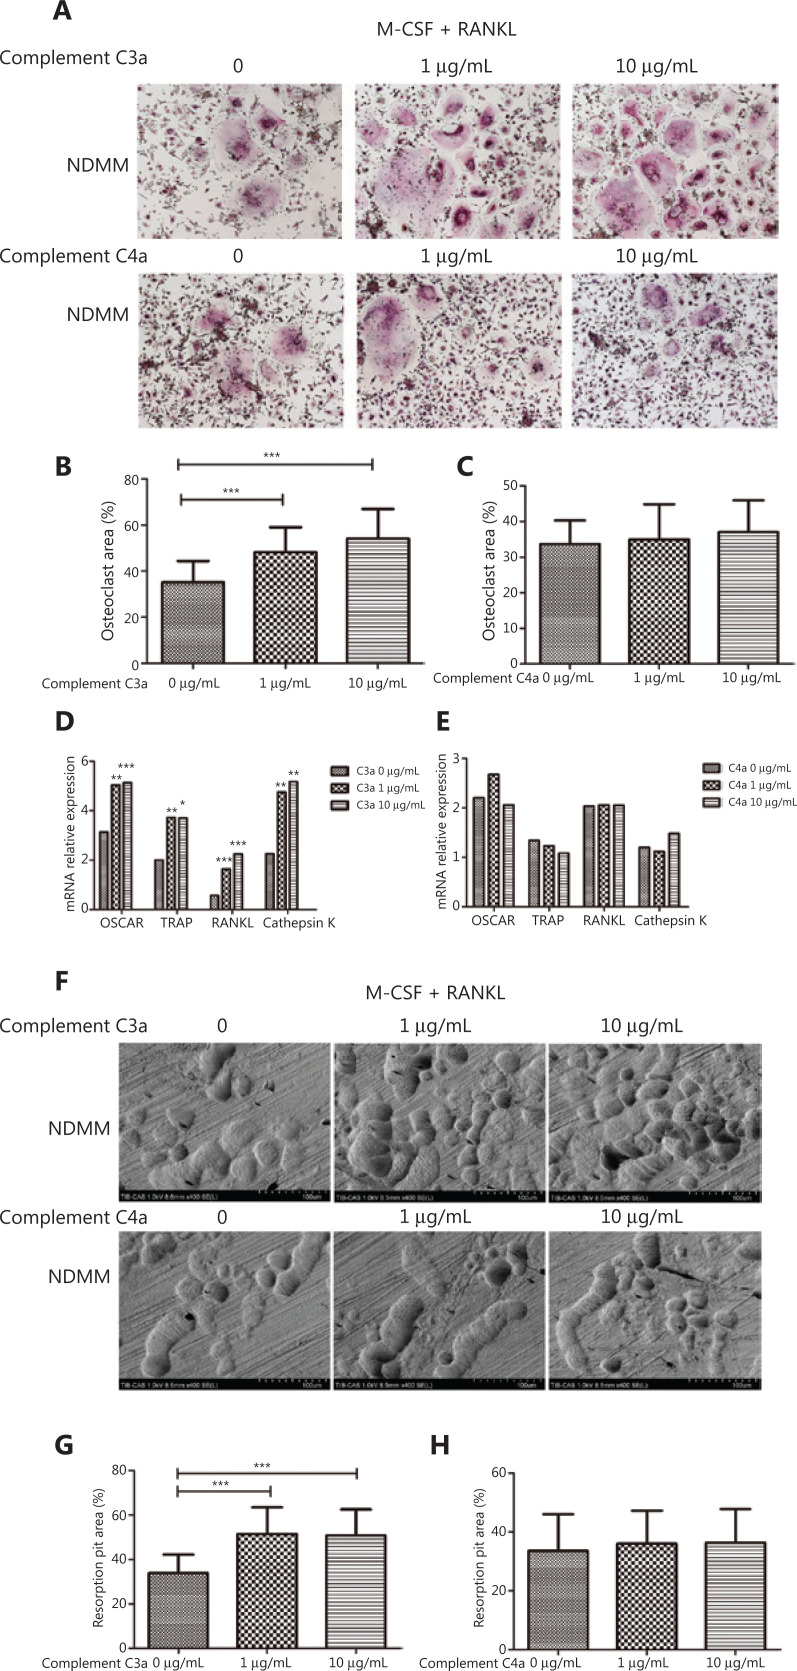
Figure 1.
Complement C3a significantly promoted the formation and function of osteoclasts, while complement C4a did not. (A) The osteoclasts areas observed by TRAP staining per view induced with 1 μg/mL and 10 μg/mL of C3a/C4a. Original magnification: 100× (bar: 100 μm).(B) The osteoclasts areas per view induced by 1 μg/mL (mean ± SD: 50.828 ± 12.984%) and 10 μg/mL (53.663 ± 12.685%) of C3a were significantly increased when compared to the control group (0 μg/mL) (34.635 ± 8.916%) (P < 0.001 and P < 0.001, respectively) (n = 30). (C) There was no difference among the osteoclasts areas between the C4a and the control group (n = 15). (D) The relative expressions of mRNAs of genes OSCAR/TRAP/RANKL/cathepsin K induced by 1 μg/mL (median: 5.041, 3.726, 1.638, and 4.752, respectively) and 10 μg/mL (median: 5.140, 3.702, 2.250, and 5.172, respectively) of C3a was significantly increased compared to the control group (median: 3.137, 2.004, 0.573, and 2.257, respectively) (1 μg/mL: P = 0.001, P = 0.003, P < 0.001 and P = 0.008, respectively; 10 μg/mL: P < 0.001, P = 0.019, P < 0.001, and P = 0.002, respectively) (n = 30). (E) There was no difference between the relative expressions of genes OSCAR/TRAP/RANKL/cathepsin K between the C4a and the control group (n = 21). (F) The absorption areas of osteoclast resorption pit per views induced by C3a/C4a. (G) The absorption areas of osteoclast resorption pit per views induced by 1 μg/mL (mean ± SD: 51.464 ± 11.983%) and 10 μg/mL (50.219 ± 12.067%) of C3a was also significantly increased (33.845 ± 8.331%) (P < 0.001 and P < 0.001, respectively) compared to the control (n = 30). (H) There was no difference among the absorption areas of osteoclast resorption pits between the C4a and the control group (n = 15) (*P < 0.05, **P < 0.01, and ***P < 0.001, respectively).

