Figure 2.
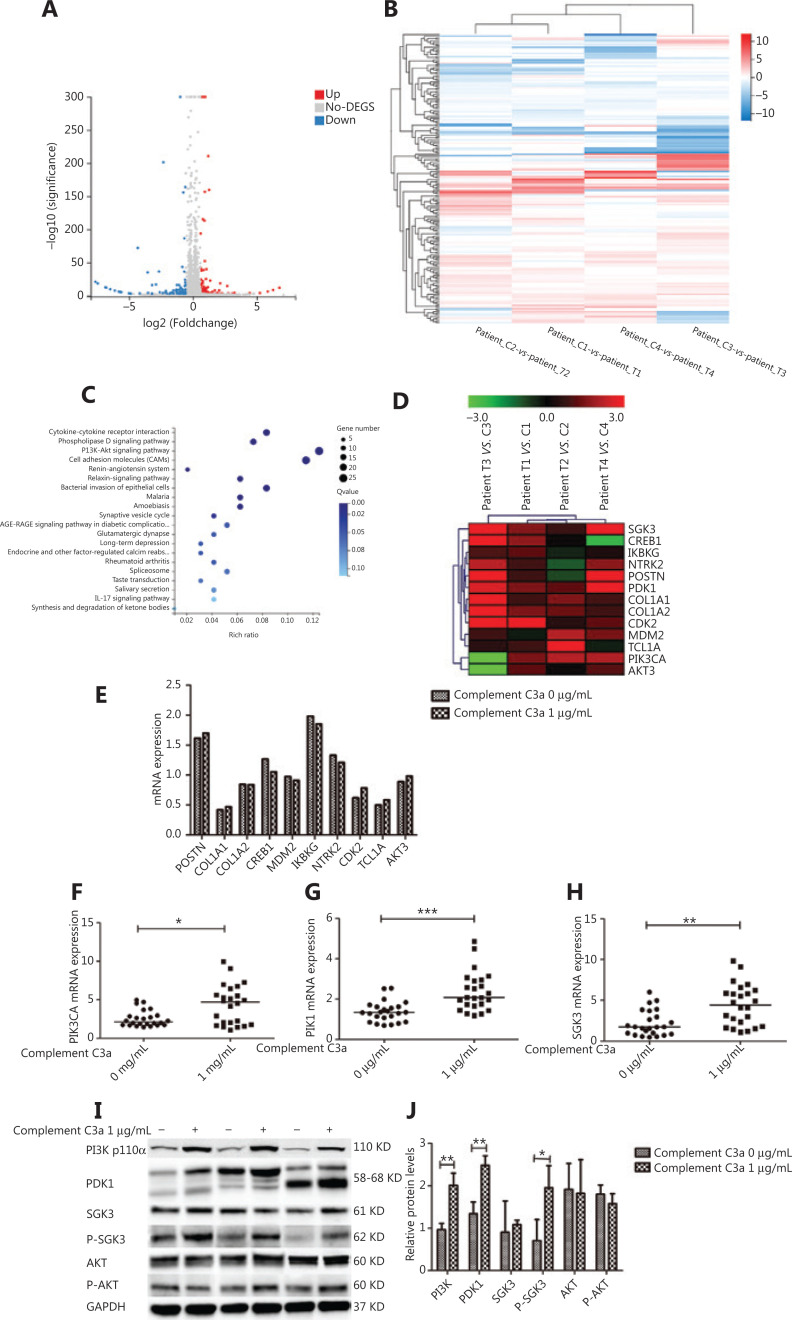
Complement C3a promoted the formation and function of osteoclasts in patients with newly diagnosed multiple myeloma (NDMM) by regulating the PI3K/PDK1/SGK3 pathway. (A) RNA-seq analysis was performed on the total RNA of osteoclasts in 4 patients with newly diagnosed MM treated with 1 μg/mL C3a and dimethylsulfoxide. There were 184 differentially expressed genes (≥ 1.5-fold change) between the C3a and the control group; 97 upregulated genes and 87 downregulated genes were shown in the volcanic map. (B) Differentially expressed genes (≥ 1.5-fold change) between the C3a and the control group are shown as a hot map. (C) The Kyoto Encyclopedia of Genes and Genomes pathway of differentially expressed genes (≥ 1.5-fold change) between the C3a and the control group was analyzed. (D) Selection of upregulated DEGs in the PI3K signaling pathways in at least 3 sequenced patients is shown as a heat map. (E) Upregulated differentially expressed genes were validated by qRT-PCR between the C3a (1 μg/mL) and the control group in 24 patients with NDMM. There was no statistically significant difference in the relative expressions of POSTN/COL1A1/COL1A2/CREB1/MDM2/IKBKG/NTRK2/CDK2/TCL1A/AKT3 between the C3a and the control group. (F, G, H) The relative expression level of PIK3CA/phosphoinositide dependent kinase-1 (PDK1)/serum and glucocorticoid inducible protein kinase (SGK3) genes (median: 4.717, 2.078, and 4.428, respectively) in the C3a group (1 μg/mL) were significantly higher than in the control group (median: 2.135, 1.336, and 1.714, respectively) (P = 0.022, P < 0.001, and P = 0.001, respectively). (I) The expressions of PI3K p110α/Akt/p-Akt/PDK1/SGK3/p-SGK3 proteins in the PI3K signaling pathway were detected by Western blot. (J) The relative grayscale levels of PI3K p110α/PDK1/p-SGK3 protein (mean ± SD: 2.012 ± 0.286, 2.481 ± 0.228, and 1.956 ± 0.519, respectively) in the C3a group (1 μg/mL) were significantly greater than the control group (mean ± SD: 0.967 ± 0.147, 1.341 ± 0.278, and 0.709 ± 0.494, respectively) (P = 0.005, P = 0.005, and P = 0.039, respectively) (*P < 0.05, **P < 0.01, and ***P < 0.001, respectively).

