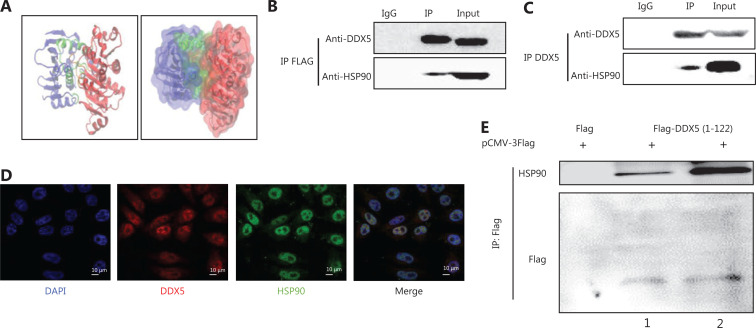
Figure 2.
DDX5 interacts directly with HSP90. (A) Molecular docking between DDX5 and HSP90. The blue area represents HSP90, and the red area represents DDX5. The green and orange areas (arrows) represent the interaction between HSP90 and DDX5. (B and C) Co-immunoprecipitation between HSP90 with overexpressed DDX5-FLAG and endogenous DDX5. Lane IgG was a negative control; Lane IP was conducted using antibodies for FLAG (upper panel) or DDX5 (lower panel) antibodies; Lane input was the cell lysate (as a positive control). (D) Subcellular co-localization of DDX5 and HSP90 using confocal microscopy (Scale bar: 10 μm). HepG2 cells were stained with DAPI (blue, nuclear staining), DDX5 antibody (red), and HSP90 antibody (green). (E) A FLAG pull-down assay of truncated DDX5 (1-122 amino acids)-FLAG fusion fragment. Lane 2 is a double loading of lane 1.

