Figure 1.
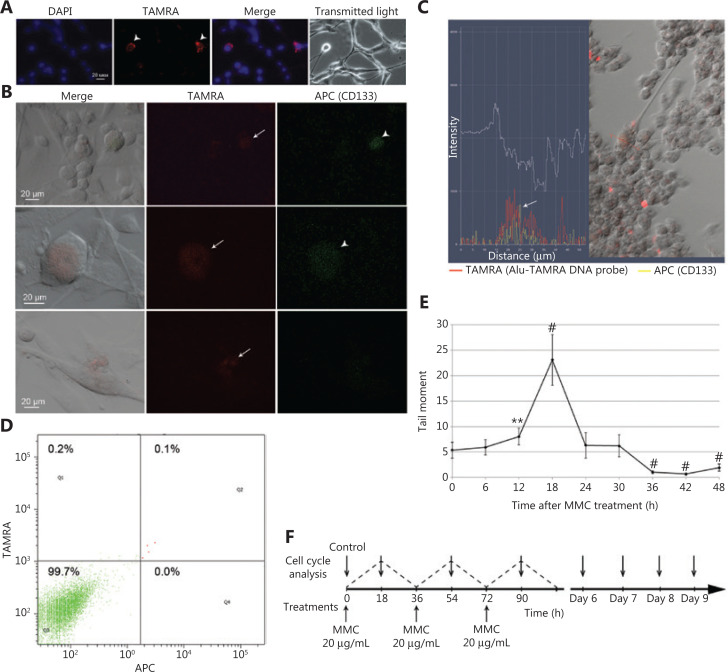
The basic Karanahan approach parameters and treatment schedule. (A) TAMRA+ cells in in vitro U87 cell culture. (B) Cross-examination of U87 cells with regard to their ability both to bind antibodies to the surface marker CD133 and to internalize the TAMRA-DNA probe. Arrows indicate TAMRA+ cells, arrowheads indicate CD133+ cells. (C) Combined fluorescence profile along the vector crossing the single U87 cell [result of processing the image obtained with LSM 780 NLO confocal microscope (Zeiss) in Zen software package]. Arrow indicates the site of colocalization of TAMRA-DNA and anti-CD133 antibodies signals. (D) FACS assay of the content of TAMRA+/CD133+ cells in in vitro U87 cell culture. DAPI, chromatin staining; TAMRA, fluorescence of the TAMRA-labeled DNA probe; APC, anti-CD133 antibodies. (E) Profile of DNA DSB occurrence in U87 cells exposed to MMC. The number of DSBs was determined as the “tail moment” during the comet assay. The average value ± 99% confidence intervals are given; confidence was estimated relative to the “zero point” using the Student’s criterion in the Statistica 10 software package, **P < 0.01, #P < 0.001. (F) Schedule for MMC treatments (three rounds every 36 h) as well as for the cell cycle assays.

