Figure 5.
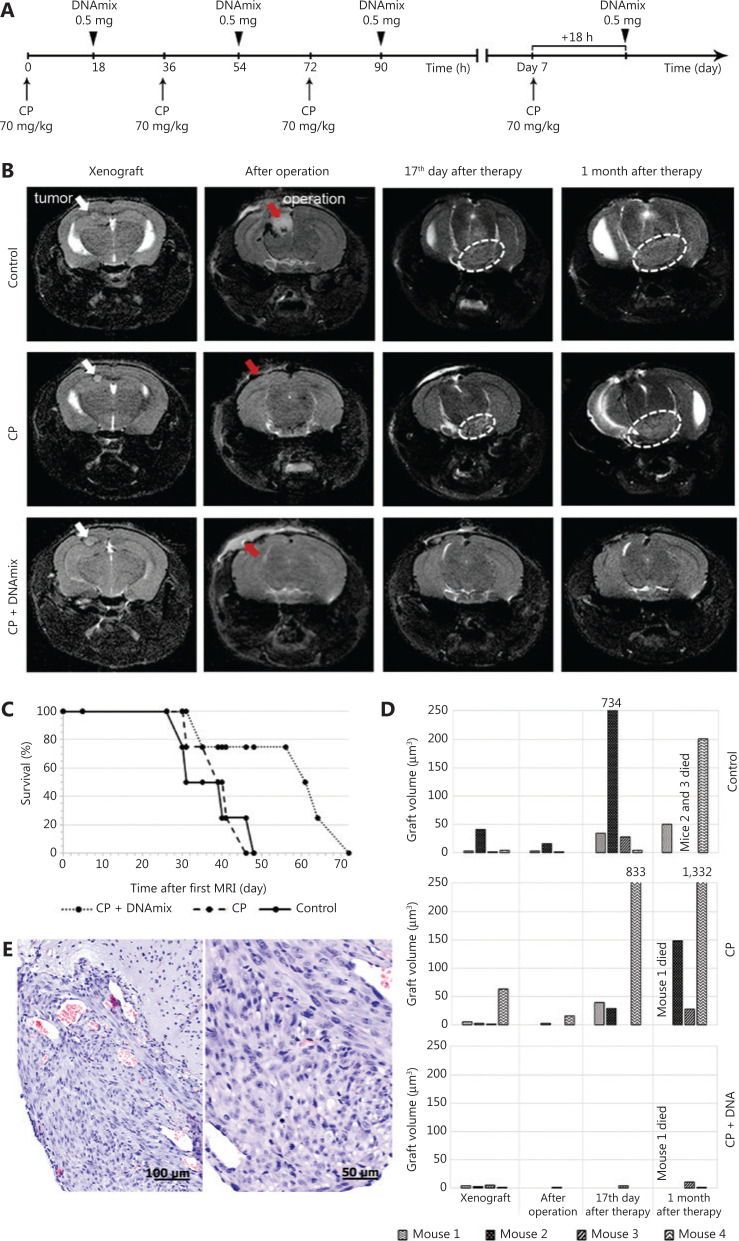
Magnetic resonance images (MRIs) of tumor nodes and survival rates of mice. (A) Schematic Karanahan approach with the schedule and dosages of CP and DNAmix administration. (B) Pictures of four sequential MRIs taken during the experiment. Preoperative MRIs indicate the presence of individual neoplastic formations with clear boundaries localized subcortically in the projection of parietal lobes (marked with white arrows) in all three groups. Postoperative MRIs indicate the total tumor resection (100% removal of tumor bulk) achieved in all the cases presented (areas of surgical intervention are marked with red arrows). On day 17 after the therapy is finished, MRIs indicate a dissemination of tumors through the cerebrospinal liquor paths to the brain basal zones (encircled with white dotted lines) in the CP and control groups. Thirty days since the end of therapy, a noticeable increase in tumor volume associated with infiltrative growth was observed in the CP and control groups, whereas the CP + DNAmix group displayed no signs of relapse. (C) Mice survival rates (Kaplan–Meier curves) during the experiment. Preoperative MRI is considered the start of the experiment. (D) Growth rates of tumors in individual animals by the experimental groups: control, CP, and CP + DNAmix. (E) Histological examination of the relapsing tumor from a mouse in the CP + DNAmix group.

