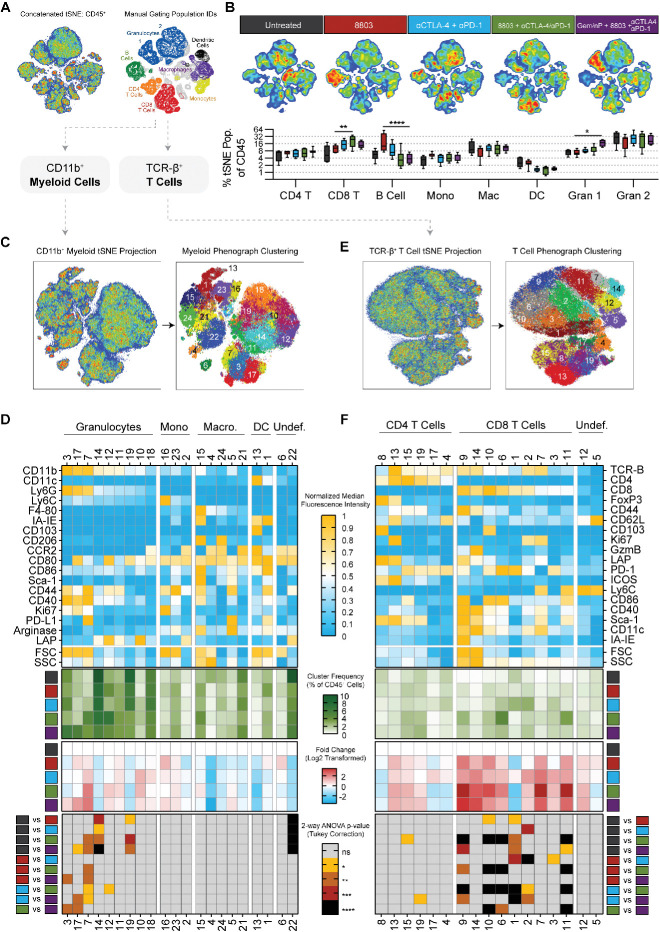
Figure 7.
Dimensionality reduction of high-parameter flow cytometry reveals inflammatory remodeling of the PDAC stroma following 8803 and checkpoint blockade. (A) Visual summary of tSNE analysis including validation of metaclusters via manual population identification. (B) Visualized deconvolution of tSNE map by treatment group and quantified metacluster frequencies as a percent of infiltrating CD45+ cells in each treatment group. (C) Phenograph clustering of all CD11b+ tumor myeloid populations. (D) Summary of all myeloid cluster data including a phenotyping heat map of each cluster using median fluorescence intensity of each marker normalized to the minimum and maximum expression levels of that marker, average cluster frequencies as a percent of infiltrating CD45+ cells in each treatment group, log2 normalized fold change in reference to untreated group frequencies, and a heat map summary of statistical significance calculations comparing each cluster frequency (% of CD45) between each treatment group. (E) Phenograph clustering of all TCR-β+ tumor T cell populations. (F) Summary of all T cell data as described for D. Data represent 5–10 mice in each treatment group and is representative of two individual experiments. Statistical significance was calculated using a two-way analysis of variance with Tukey’s correction for multiple comparisons. *P<0.05, **p<0.01, ***p<0.001, ****p<0.0001. ns, not significant; PDAC, pancreatic ductal adenocarcinoma; tSNE, t stochastic neighbor embedding.

