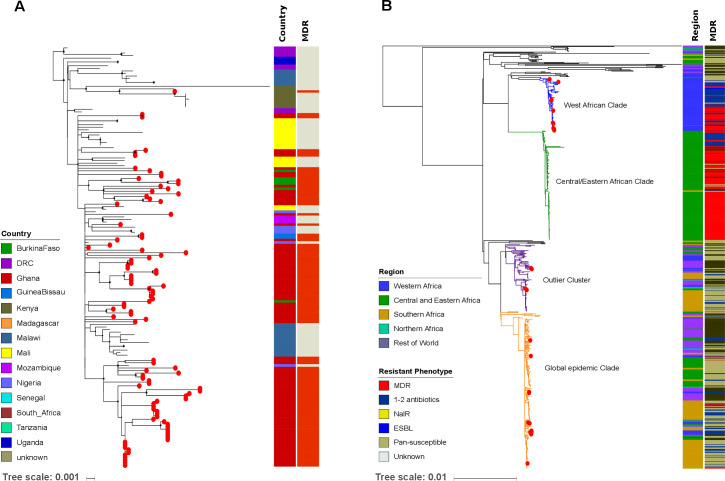
Figure 4.
Phylogenetics of S. Typhimurium ST313 lineage II and S. Enteritidis ST11 in sub-Saharan Africa. (A) Maximum likelihood phylogenetic tree of S. Typhimurium-ST313 lineage II isolates from this study in the context of the sub-Saharan African continent; lineage I was pruned to enhance the visualisation of the tree. Red circles at the terminal leaves correspond to our study isolates. The first column shows different colour-coded countries from where all analysed isolates originate. The second column shows MDR and non-MDR isolates in red and grey, respectively. (B) Maximum likelihood phylogenetic tree of our S. Enteritidis-ST11 isolates in the global context of S. Enteritidis. Red circles at the terminal leaves correspond to our study isolates. The first and second columns show regions and resistant phenotypes in different colours. The tree scale bar indicates the number of substitutions per variable site.

