Figure 5.
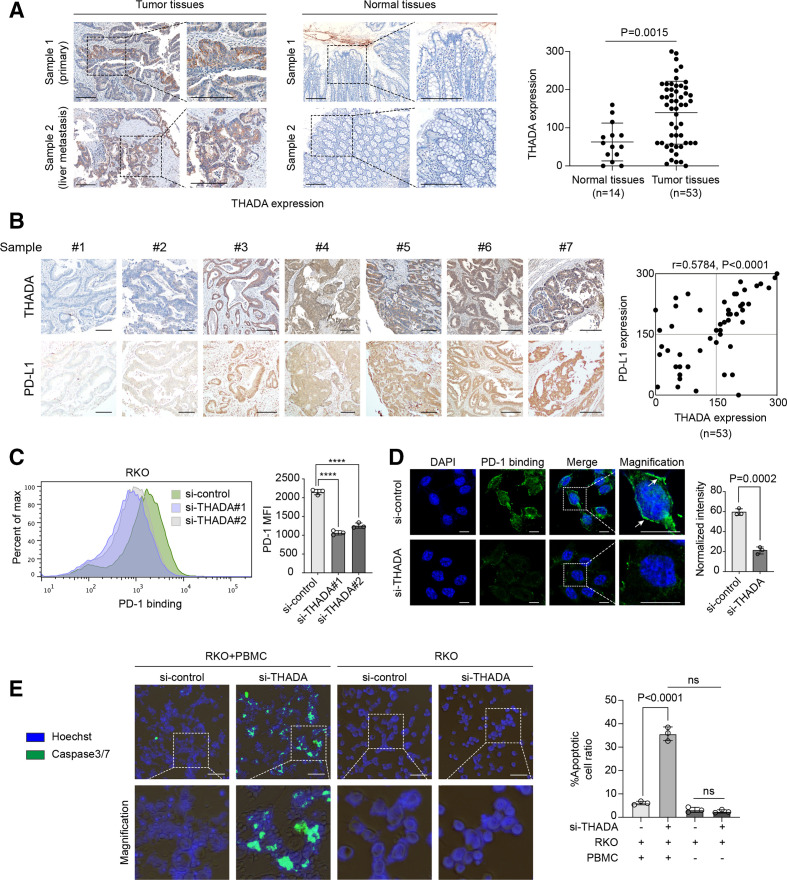
Depletion of thyroid adenoma associated gene (THADA) promoted T cell-mediated antitumor effect. (A) Left, representative immunohistochemistry (IHC) results of colorectal cancer (CRC) tissue microarrays displaying THADA expression in tumor tissues and normal tissues. Scale bars, 200 µm. Right, statistical result for THADA expression assessed using H score. The p value was determined by two-sided Student’s t-test. (B) Left, representative IHC results of CRC tissue microarrays displaying the expression of THADA and programmed death-ligand 1 (PD-L1) in tumor tissues of the same cases. Scale bars, 200 µm. Right, statistical result for THADA and PD-L1 expression assessed using H score. The p value was determined by two-sided Pearson’s correlation (p<0.0001). (C) Left, flow cytometry examining programmed cell death 1 (PD-1) binding on RKO cells transfected with THADA small interfering RNAs (siRNAs). Right, quantification of mean fluorescence intensity (MFI) of PD-1. Values are means±SD from three independent experiments. Statistical differences were evaluated by analysis of variance (ANOVA) post hoc test (Tukey). ****P<0.0001. (D) Left, immunofluorescence revealing PD-1 binding on RKO cells transfected with THADA siRNAs. White dashed boxes denote the representative fields to be magnified, and the arrows indicate the binding sites. Scale bars, 10 µm. Right, values are means±SD from three independent experiments. Statistical differences were evaluated by two-sided Student’s t-test. (E) T cell killing assay. Left, cell nuclei were stained with Hoechst (blue), and apoptotic cells were stained with fluorescent dyes of caspase3/7 cleavage (green). The fluorescence images were merged with phase-contrast images of the cultured RKO cells. White dashed boxes denote the representative fields to be magnified. Scale bars, 50 µm. Right, values are means±SD from n=3 independent experiments. The p values were evaluated by ANOVA post hoc test (Tukey); ns, no significance.

