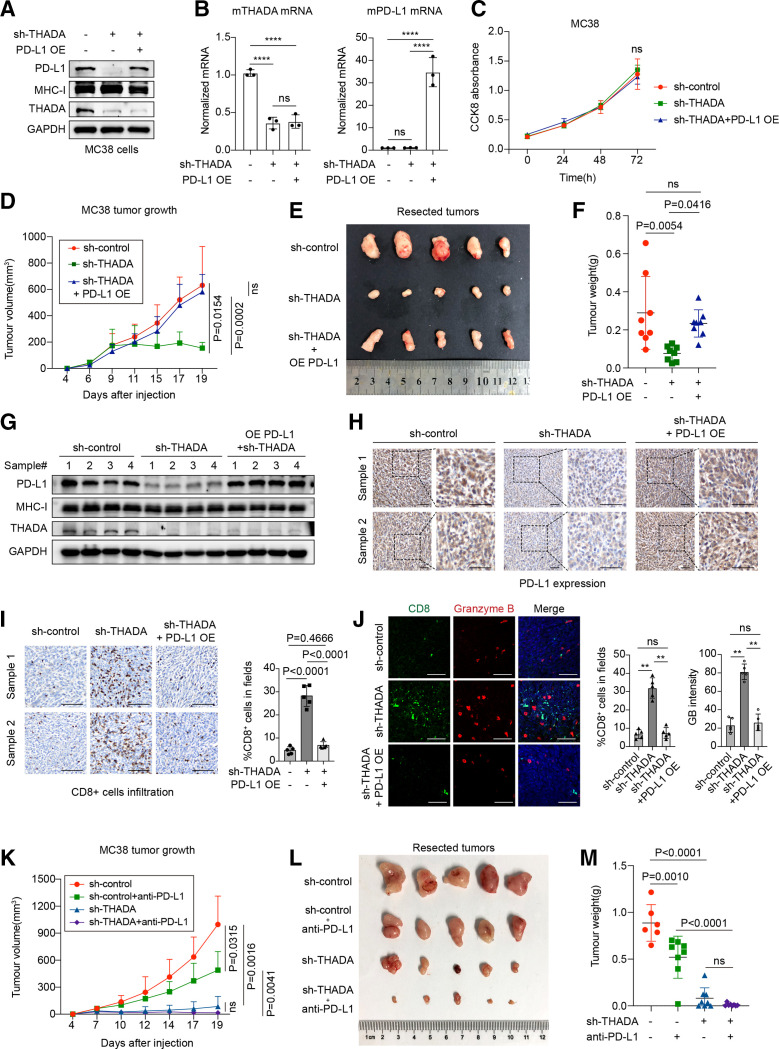
Figure 6.
Targeting thyroid adenoma associated gene (THADA) improved programmed death-ligand 1 (PD-L1)-dependent tumor immune response in vivo. (A) Western blot analysis testing the expression of PD-L1, major histocompatibility complex (MHC)-I and THADA in indicated MC38 stable clones used for establishing tumor models. The experiment was repeated three times independently with similar results. (B) RT-PCR showing the mRNA expression of mouse THADA (left) and mouse PD-L1 (right) in indicated MC38 stable clones. Values are means±SD from n=3 independent experiments. Statistical differences were evaluated by analysis of variance (ANOVA) post hoc test (Tukey). ****P<0.0001; ns, no significance. (C) CCK8 viability assay examining the proliferation rate of indicated cultured MC38 stable clones. The experiment was repeated three times independently with similar results. Statistical differences were determined by ANOVA test. (D) Tumor growth rate of each group inoculated with indicated MC38 stable clones. The dots denote means and 95% CIs (two-way ANOVA; n=8 per group). (E) The images of resected tumors from mice. (F) Tumor weight of each individual. Values are means±SD (n=8 per group). Statistical differences were evaluated by ANOVA post hoc test (Tukey). (G) Western blot analysis showing the expression of PD-L1, MHC-I and THADA in indicated tumor tissues. (H) Immunohistochemistry assay showing mouse PD-L1 expression in indicated tumor tissues. Dashed boxes denote the representative fields to be magnified. Scale bars, 50 µm. (I) Left, immunohistochemistry assay revealing CD8+ cell infiltration in indicated tumor tissues. Scale bars, 100 µm. Right, quantification of CD8+ cell infiltration in indicated tumor tissues. Values are means±SD from five independent samples from each group. The p value was determined by ANOVA post hoc test. (J) Immunofluorescence assays showing CD8+ T cell infiltration and granzyme B release in indicated tumor tissues. Scale bars, 50 µm. Values are means±SD from five independent samples of each group. Statistical differences were evaluated by ANOVA post hoc test (Tukey). **P<0.0001; ns, no significance. (K) Tumor growth rate of each group that received indicated treatment after inoculation of indicated MC38 stable clones. The points indicate means and 95% CIs (two-way ANOVA; n=8 per group). (L) Images of resected tumors from mice. (M) Tumor weight. Values are means±SD and statistical differences were determined by ANOVA post hoc test (Tukey).

