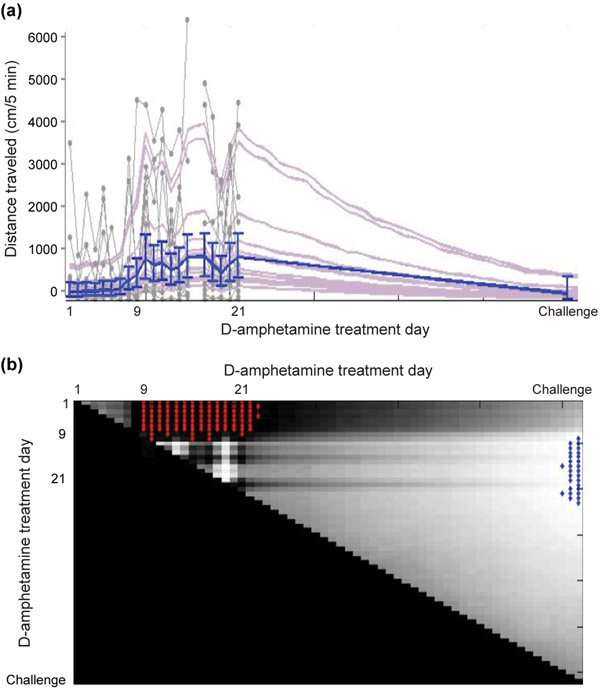
FIGURE 4.
Model of distance traveled data shows a significant increase in late-phase locomotion beginning on D-amphetamine treatment day 9. (a) Distance traveled in the 80–85 min time bin across days. The raw data from each of the 12 mice are plotted as gray dots joined by lines, with estimates of individual fit to distance traveled (light purple) and group median estimate with 90% credible intervals (blue). (b) Day-by-day comparison of the state-space fit to the group estimates of distance traveled shown in A. Each point on the surface represents the probability that the group estimate on the day shown on the x-axis is higher than the day shown on the y-axis. Light colored surface indicates very low probability, and blue highlight indicates P < 0.005. Conversely, dark color shows that the day on the x-axis is higher than the day on the y-axis near P = 1, and red highlight means P > 0.995.

