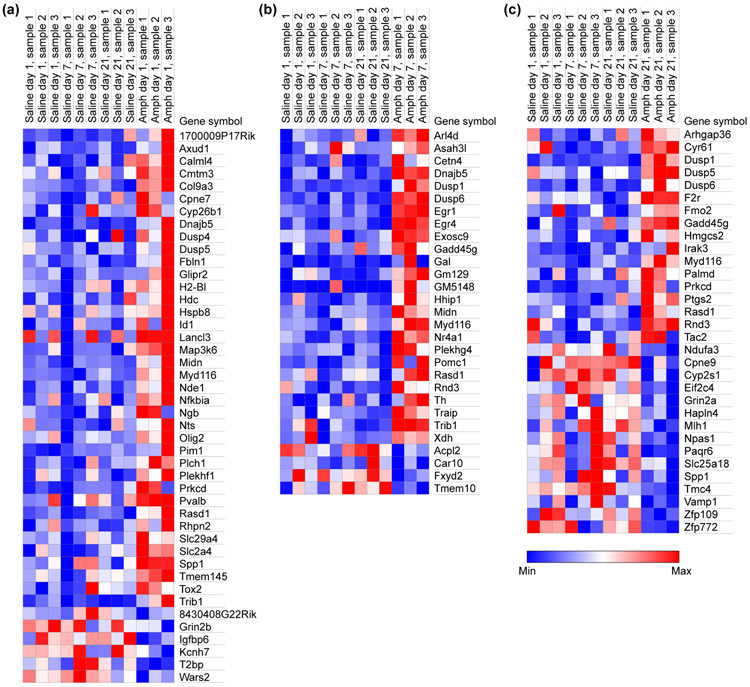
FIGURE 7.
The heat maps for gene expression changes show the sharpest differences on high-stereotypy day 7, and progressively lower proportions of upregulated genes across all days. Each column shows results from one mouse for genes that were significantly different in group comparisons between saline-treated mice and mice treated with D-amphetamine for 1 day (a; modest behavioral response), 7 days (b; prolonged stereotypy response) and 21 days (c; strong behavioral response with curtailed stereotypy period) . Genes with RPKM < 1 in all samples, or that were changed in any pair-wise comparisons among saline-treatment groups, were removed.

