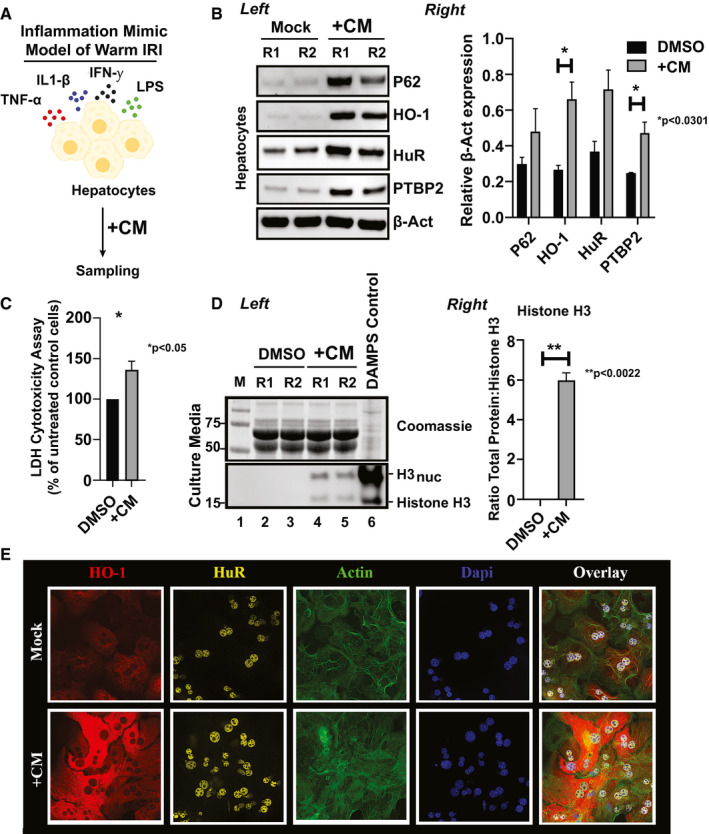
Figure 2.

Cytokine stimulation of primary‐derived hepatocytes mimics reperfusion injury by causing the up‐regulation of HO‐1/HuR protein levels. (A) Workflow of the in vitro inflammation mimic model of warm IRI, dependent on CM)preconditioning. (B) Left: total lysates from cells treated with either DMSO or CM for 12 hours were probed by western blot for expression differences between P62 (marker for autophagy), HO‐1 (subject of study), HuR (subject of study), PTPB2 (downstream marker of HuR), or β‐Act (as loading control). Right: an unpaired two‐tailed Student t test of representative samples presented calculated relative β‐Act expression (*P < 0.0301, +CM vs. DMSO control). Data are shown as mean (n = 3/group) ± SEM. (C) Lactate dehydrogenase (LDH) release after CM hepatocytes treatment as a percentage of untreated control cells (*P < 0.05, +CM vs. DMSO control). (D) Left: hepatocellular toxicity was assessed by probing for histone H3 levels from culture media (bottom panel). Histone H3 versus H3nuc (the nucleosome‐associated form) represent minus (naked) or plus nucleosome association. Coomassie‐stained polyacrylamide gel electrophoresis samples were used as loading controls (top panel). Positive DAMPs control was obtained from hepatocytes treated 48 hours with 1× HBSS. Right: data shown are mean ± SEM of representative samples as presented. **P < 0.0022, CM versus DMSO for n = 3 pooled samples. (E) Representative immunohistochemical detection of hepatocyte HuR and HO‐1 after 12 hours CM conditioning (n = 3/group; original magnification, ×40). Act, actin; Dapi, 4′,6‐diamidino‐2‐phenylindole.
