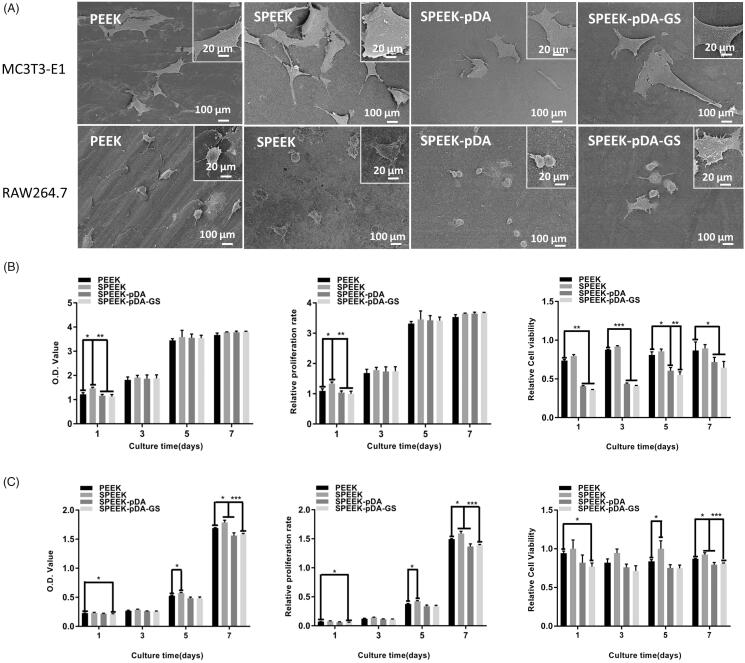
Figure 4.
(A) SEM images of MC3T3-E1 and RAW264.7 cells after being cultured on different samples for 24 h at low and high magnifications. OD value, proliferation ability, and cell viability of MC3T3-E1 (B) and RAW264.7 (C) cells in different groups on days 1–7 detected using the CCK-8 assay. The value of 1 in the Y-axis of the third column of (B) and (C) is the cell viability in plate without any sample interference. (n = 3, * p < .05, ** p < .01, and *** p < .001).

