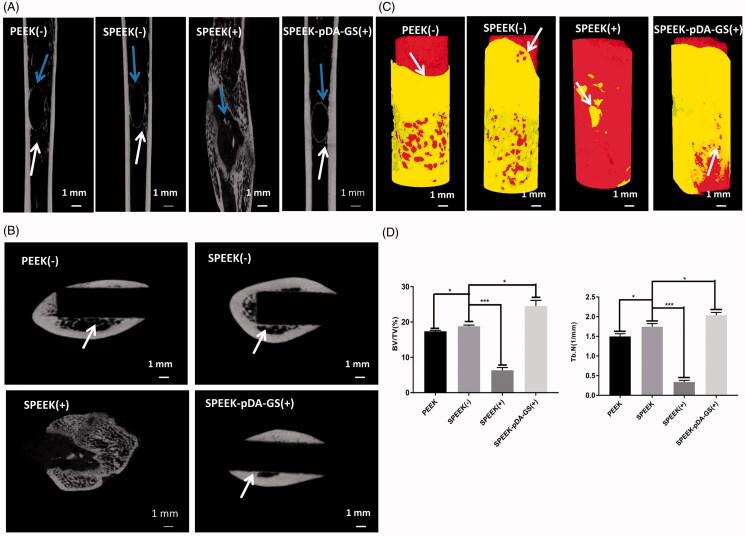
Figure 8.
(A) Horizontal axis image of the implant. Blue arrows show the new bone around the implant, and white arrows show the trabeculae. (B) Vertical axis image of the implant. White arrows show where the new bone is attached to the implant. (C) 3 D reconstruction images of different samples of bone implants. The white arrow indicates the interface where the implant connects to the surrounding bone. (D) Quantitative analysis of (a) BV/TV and (b) Tb.N after implantation for six weeks with different modified PEEK samples. The implantation rats were PEEK (-), SPEEK (-), SPEEK (+), and SPEEK–pDA–GS (+) groups, respectively. (n = 3, * p < .05, ** p < .01, and *** p < .001).

