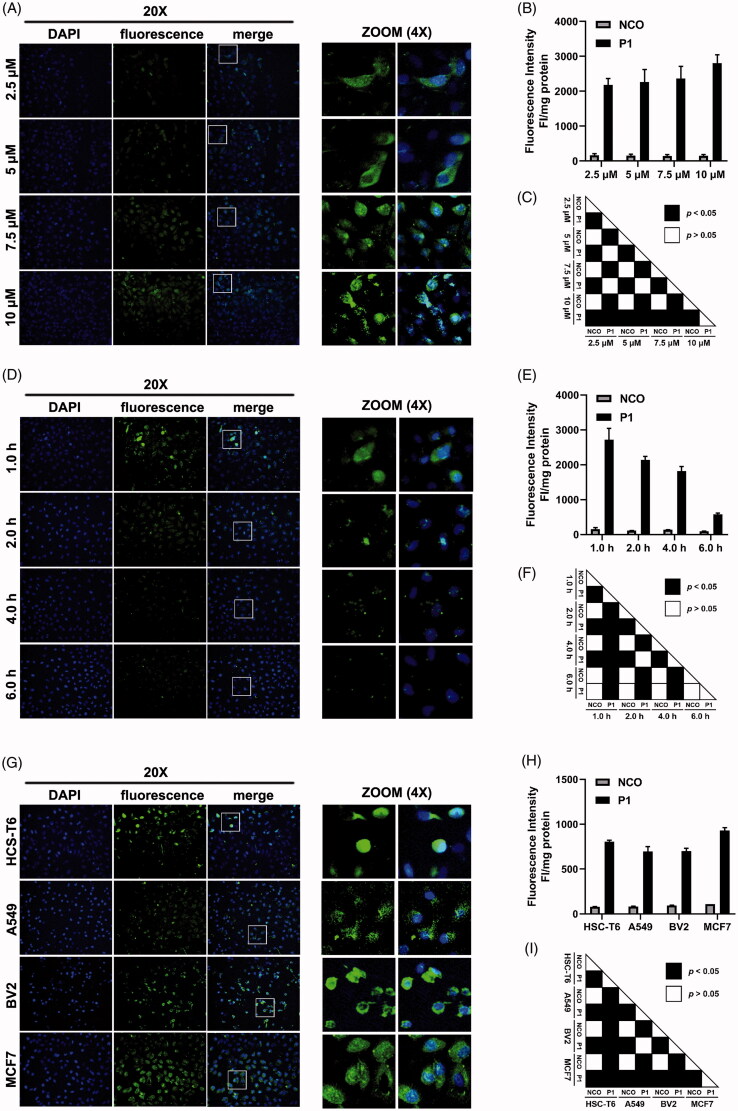
Figure 3.
Penetration property validation. (A) Fluorescence microscopy images of peptide P1 penetration at indicated peptide concentration. White box indicated 4 times zoom region shown in the right panel. (B) Quantification of fluorescent intensity of peptide P1 penetration at indicated peptide concentration. The fluorescence of the cellular uptake was normalized by cellular protein. Values represent mean ± SEM. (C) The corresponding p-value plot between data pairs presenting in (B). The one-way analysis of variance (ANOVA) was used to compare the differences between the control and experimental values. (D) Fluorescence microscopy images of peptide P1 (5 μM) penetration with different incubation times. White box indicated 4 times zoom region shown in the right panel. (E) Quantification of fluorescent intensity of peptide P1 (5 μM) penetration with different incubation times. The fluorescence of the cellular uptake was normalized by cellular protein. Values represent mean ± SEM. (F) The corresponding p-value plot between data pairs presenting in Figure 3(E). ANOVA was used to compare the differences between the control and experimental values. (G) Fluorescence microscopy images of peptide P1 (5 μM) penetration in different cell lines. White box indicated 4 times zoom region shown in the right panel. (H) Quantification of fluorescent intensity of peptide P1 (5 μM) penetration in different cell lines. The fluorescence of the cellular uptake was normalized by cellular protein. Values represent mean ± SEM. (I) The corresponding p-value plot between data pairs presenting in Figure 3(H). ANOVA was used to compare the differences between the control and experimental values.

