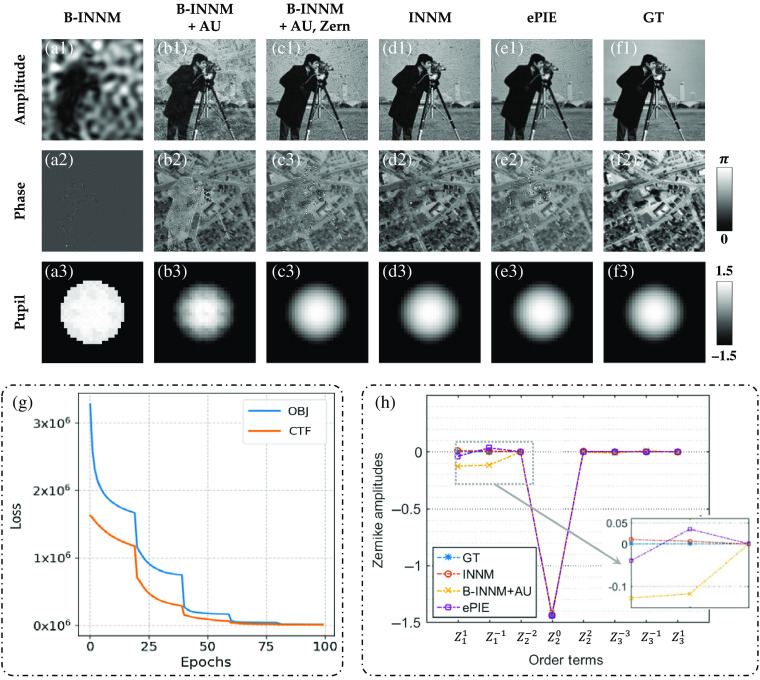
Fig. 3.
Comparison of recovered results and some decomposed Zernike amplitudes. (a)–(f) Recovered results of the sample and pupil function under different methods (the amplitude are normalized into 0 to 1). (g) Decline curve of the INNM. (h) A scatter plot of some decomposed Zernike polynomial coefficients (piston coefficient is not present).

