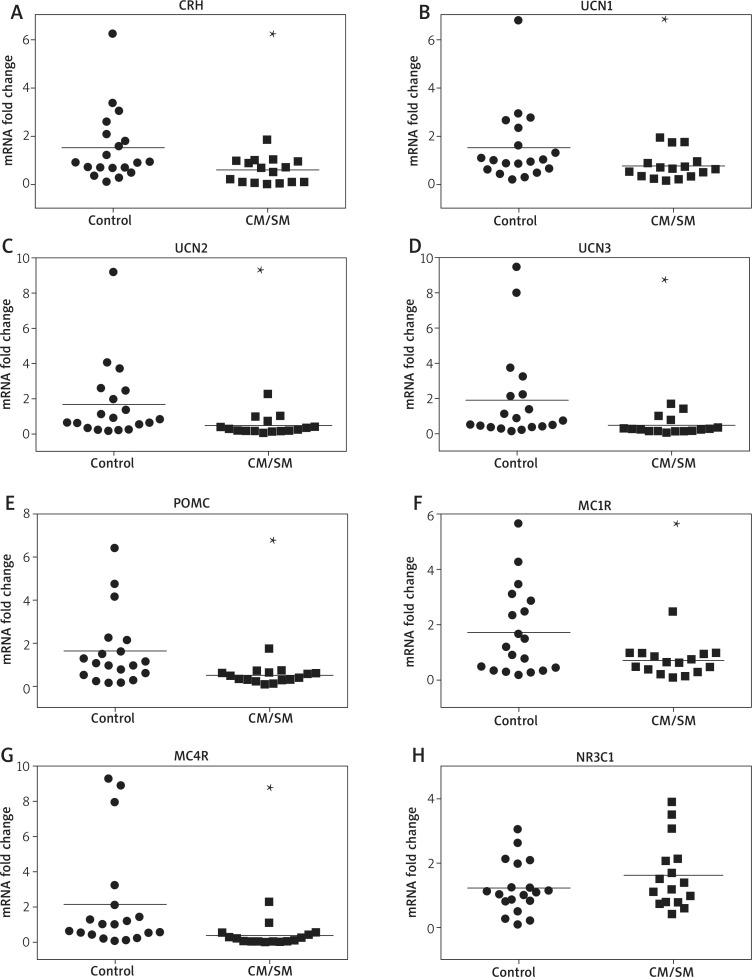
Figure 1.
Differential expression of elements of sHPA axis in the urticaria pigmentosa (CM/SM patients) in comparison to control skin samples. The relative levels of mRNA for the chosen genes (as indicated on panels: A-G) were assessed in full thickness skin bioptates of MS patients (squares) and non-affected donors (dots). The relative mRNA levels for each individual in both groups were shown in relation to the average results for the control group (set as 1). Fold changes were shown in a logarithmic scale. The horizontal line represents the mean result for each group. Student's t-test analysis was used to analyse the data. *p < 0.05; **p < 0.01; ***p < 0.001

