
Figure 7 .
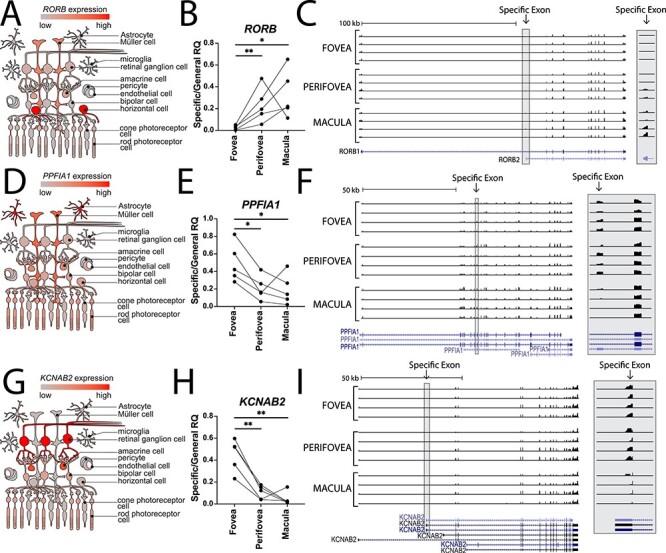
Regionally expressed retinal isoforms. Using the bulk RNA sequencing data, RORB (A–C), PPFIA1 (D–F) and KCNAB2 (G–I) were identified as differentially spliced between the fovea, parafovea and macula. The scRNA-seq data was used to identify which cell type most highly expressed each gene (left column). Differential isoform abundance in each region was validated by RT-qPCR isoform-specific primers (middle column, see Materials and methods). Coverage tracks show reads mapped to each exon (right column), with an inset to illustrate the differentially expressed exons at higher magnification (grey box).