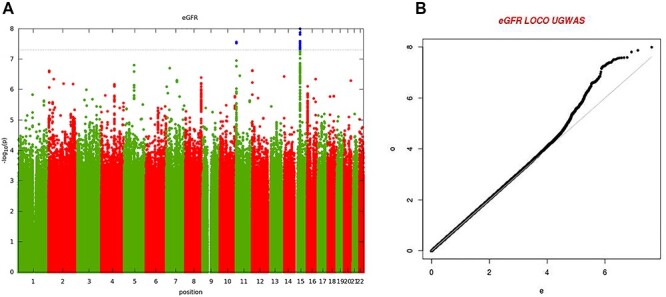
Figure 1 .

(A) Manhattan plot of genome-wide associations of eGFR in 3288 Ugandan individuals from the GPC. Each point denotes a variant with MAF > 0.5%, with the x-axis representing the genomic position and y-axis representing the strength of association (−log10 P-value). The dotted line shows the genome-wide significance threshold of P < 5 × 10⁻⁸. (B) Quantile-Quantile plot of genome-wide associations of eGFR: the genome-wide genomic control inflation factor was 1.01.
