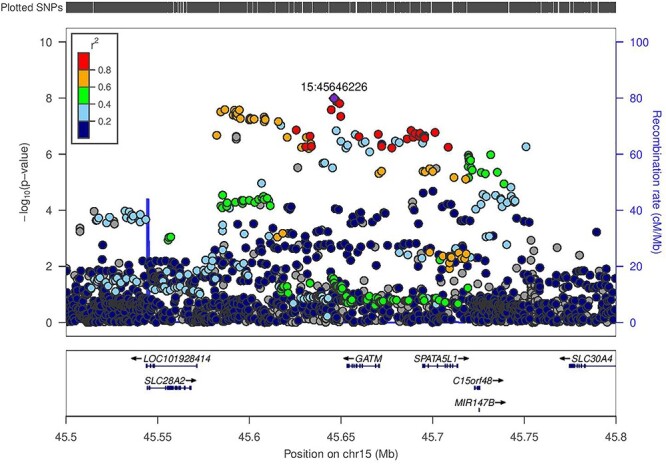
Figure 2 .

Regional association plot for eGFR in 3288 Ugandan individuals from the GPC at the GATM locus. The lead SNP rs2433603 (15:45646226) (P = 1.0 × 10⁻⁸) is coloured in purple. LD (r2) with other SNPs at the locus was calculated on the basis of the Ugandan SNP genotypes used in this study.
