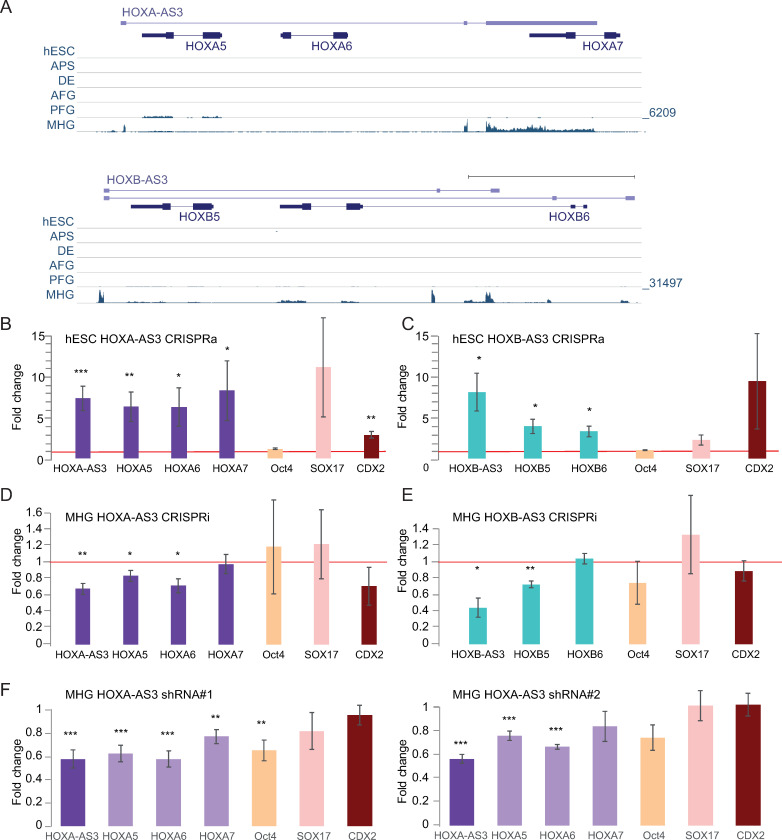
Fig 7. Function of HOXA-AS3 and HOXB-AS3 during endodermal differentiation of hESCs.
(A) Read coverage in RNA-seq data from [38] for shown parts of the HOXA (top) and HOXB (bottom) clusters. In each cluster all the tracks are normalized together. (B-C) Expression levels estimated by qRT-PCR for the indicated genes in hESCs following CRISPRa-mediated 48h activation of HOXA-AS3 (n = 7/4) (B) and HOXB-AS3 (n = 3) (C). (D-E). Expression levels estimated by qRT-PCR in MHG cells following CRISPRi-mediated repression of HOXA-AS3 (n = 3) (D) and HOXB-AS3 (n = 3) (E). (F) Changes in expression of the indicated genes following infection of hESCs with two separate HOXA-AS3 shRNAs, followed by differentiation to MHG. n = 6. *—P<0.05; **—P<0.005; ***—P<0.005. Two sided t-test. Errors bars—SEM.

